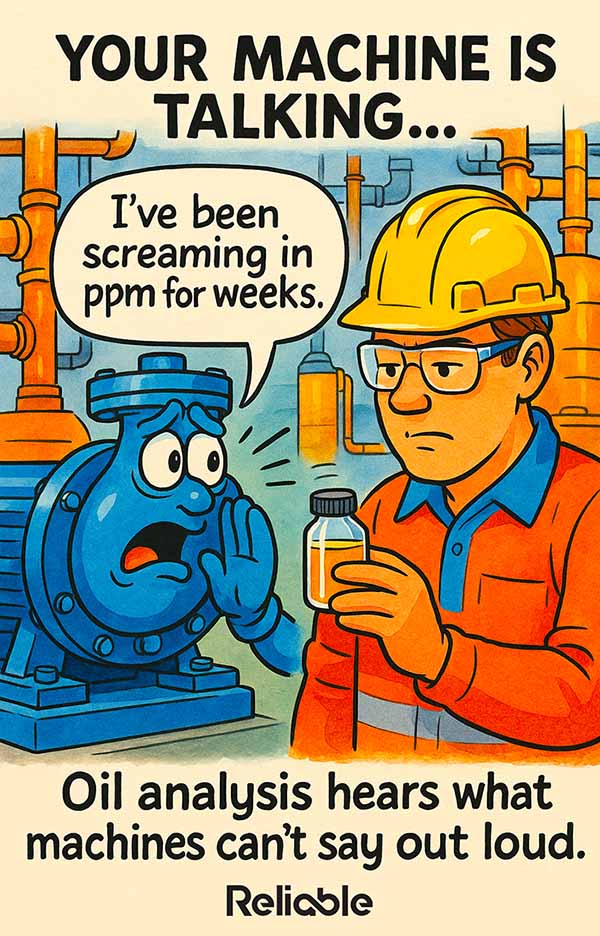

Your equipment is trying to communicate. Every gearbox, hydraulic system, compressor, and turbine generates a constant stream of information about its internal condition. The problem is that most of this information is locked inside the machine, invisible to the naked eye and inaudible over the noise of a running plant.
Oil analysis is the interpreter. By examining the lubricant flowing through your equipment, you can decode what’s happening inside: which components are wearing, what contaminants have entered the system, whether the oil itself is still doing its job. It’s one of the most powerful condition monitoring technologies available, and it remains underutilized at a surprising number of facilities.
What Oil Analysis Actually Measures
A comprehensive oil analysis report covers three broad categories: fluid condition, contamination, and wear debris. Each one tells a different part of the story.
Fluid condition tests evaluate the lubricant itself. Is the oil still performing as intended? Key measurements include viscosity (the most fundamental property of any lubricant), total acid number (TAN), total base number (TBN), and oxidation levels. These tests reveal whether the oil has degraded through heat exposure, chemical reaction, or simple age.
Viscosity shifts are particularly telling. An oil that’s grown thicker than its original grade may be oxidizing or contaminated with soot. An oil that’s thinned out may be diluted with fuel, solvent, or the wrong lubricant from a top-off error. Either direction signals trouble.
Oil analysis is the closest thing we have to a blood test for industrial equipment. It reveals problems that vibration, temperature, and sound can’t detect until the damage is already advanced.
Contamination testing identifies foreign materials that shouldn’t be in the oil. Water is the most common and most damaging contaminant in industrial lubricants. Particle counts reveal the cleanliness level of the fluid and can indicate filter bypass, breather failure, or external ingress from seals that have lost integrity.
Fuel dilution, glycol contamination (from coolant leaks), and silicon (from dirt ingress) are other contamination markers that point to specific failure modes. Each contaminant tells you where the system’s defenses have broken down.
Wear Debris: The Machine’s Fingerprint
Wear metal analysis is where oil analysis gets truly diagnostic. By measuring the concentration of specific metals in the oil, analysts can identify which internal components are wearing and at what rate.
Iron typically comes from gears, shafts, and cylinder liners. Copper and tin point to bushings and thrust washers. Lead often originates from bearing overlays. Chromium can indicate piston ring wear. Aluminum may come from pistons, pumps, or bearing cages.
The key insight is that every machine has a unique wear metal signature when it’s running normally. Deviations from that baseline are the early warning. A gearbox that normally generates 15 ppm of iron suddenly showing 45 ppm is telling you something has changed, even if vibration readings still look clean.
This is one of the areas where oil analysis has a distinct advantage over other condition monitoring methods. Vibration analysis excels at detecting mechanical faults like imbalance, misalignment, and bearing defects. But oil analysis can detect abnormal wear weeks or months before that wear produces enough vibration to trigger an alert.
Building an Effective Oil Analysis Program
The technology behind oil analysis is mature and well understood. The challenge for most plants isn’t the lab work; it’s everything that surrounds it: sampling practices, frequency decisions, trending, and (most critically) acting on the results.
Sampling technique matters more than most people realize. A poorly drawn sample can produce misleading results that send your maintenance team chasing ghosts. The fundamentals of good sampling include:
- Pulling samples from a live, turbulent zone in the system (never from the bottom of a stagnant reservoir where sediment collects and skews results).
- Using clean, dedicated sampling equipment that hasn’t been contaminated by previous use on different machines or lubricant types.
- Sampling at consistent intervals and under consistent operating conditions, so results are comparable across time and trends remain meaningful.
- Labeling samples with complete machine identification, oil type, hours in service, and any recent maintenance actions that might affect the results.
These practices sound basic, and they are. But inconsistent sampling is the single most common reason oil analysis programs fail to deliver actionable data.
A single oil sample can tell you whether your equipment is wearing normally, overheating, contaminated with water, or running on degraded lubricant. That’s four diagnostics from one 100-milliliter bottle.
Sampling frequency depends on the criticality of the equipment and the severity of the operating environment. High-value assets in harsh conditions (large gearboxes, hydraulic systems in dirty environments, turbines) might warrant monthly sampling. Less critical or less stressed equipment can often go quarterly.
The right frequency is the one that gives you enough data points to spot a developing trend before the trend becomes a failure. For most industrial applications, that’s somewhere between monthly and quarterly, with more frequent sampling during commissioning, after oil changes, or when previous results showed anomalies.
Interpreting Results: Trends Over Snapshots
One of the most common mistakes in oil analysis is treating each report as a standalone snapshot. A single result that reads “normal” or “abnormal” in isolation tells you very little. The real value comes from trending results over time.
Consider a hydraulic system that shows 12 ppm of iron in its latest sample. Is that alarming? If the previous five samples averaged 10 ppm, probably not. If they averaged 3 ppm, something has clearly changed. The absolute number means less than the trajectory.
Setting Alarm Limits
Effective oil analysis programs use tiered alarm limits: caution and critical thresholds for each measured parameter. These limits should be based on your own equipment’s historical data, not generic industry defaults.
Generic limits have their place during the first year of a new program, when you’re establishing baselines. After that, your historical data will produce far more accurate and actionable thresholds than any published table.
Key practices for getting the most diagnostic value from your oil analysis reports include:
- Reviewing results within 48 hours of receiving them from the lab, while the information is still timely enough to drive maintenance decisions.
- Correlating oil analysis data with vibration and thermography findings for a more complete picture of equipment health.
- Tracking rate-of-change in wear metals rather than focusing on absolute values, because a rapid increase from 5 to 20 ppm is more significant than a stable reading at 25 ppm.
When oil analysis, vibration data, and thermal scans all point in the same direction, you can make maintenance decisions with confidence. When they disagree, you have a reason to investigate further before committing resources.
The most valuable oil analysis programs treat every sample as a data point in a long-term trend. Individual results matter, but the trajectory tells the real story.
Common Pitfalls and How to Avoid Them
Even well-intentioned oil analysis programs can stumble. The most frequent failures share a few patterns.
Sampling inconsistency tops the list. If samples are drawn from different ports, at different temperatures, or at irregular intervals, the resulting data is noisy enough to obscure real trends. Standardize the process, train the people, and audit compliance.
Failure to act on results is the second most common problem. Some plants generate excellent data, store it in binders or databases, and never translate it into work orders. The analysis is only valuable if it connects to the maintenance planning process.
Over-reliance on the lab’s interpretation is another trap. Most labs provide generic comments based on industry-wide alarm limits. Their analysts don’t know your specific equipment, operating conditions, or maintenance history. Internal review by someone who understands the application context is essential for turning data into decisions.
The Return on Investment
Oil analysis is one of the most cost-effective condition monitoring tools available. A typical sample costs between $25 and $75 depending on the test slate. Compare that to the cost of a single unplanned bearing replacement ($5,000 to $50,000 or more, depending on the machine) and the math is overwhelming.
Plants with mature oil analysis programs routinely report 3:1 to 10:1 return on investment through avoided failures, extended oil drain intervals, and optimized maintenance scheduling. The data doesn’t just prevent breakdowns; it also prevents unnecessary oil changes and premature component replacements.
Your equipment has been trying to tell you something for a long time. The wear metals in the oil, the moisture levels, the viscosity trends: they’re all signals. Oil analysis gives those signals a voice. The only question is whether your maintenance program is set up to listen.