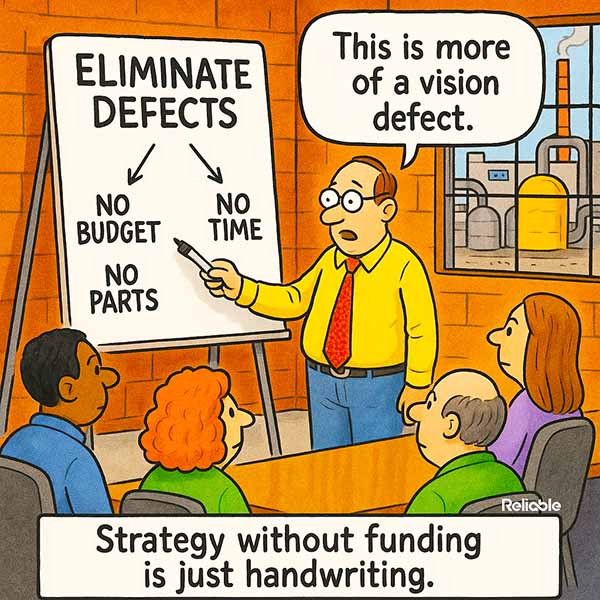

Most maintenance leaders have written a defect elimination plan that looked great on paper and got nowhere. The vision was clear. The targets were measurable. The follow-through never showed up because the funding never showed up. If you want to justify maintenance budget increases at your plant, the plan itself is the easy part. The hard part is translating maintenance pain into the language CFOs already use, with traceable numbers they can review.
This article walks through how reliability leaders earn approval for the people, parts, and tools their programs need. The pattern is consistent across industries. Strategy travels with funding, and the people who get funding speak finance. Read it less as a script and more as a checklist for the next budget cycle, whether you are asking for fifty thousand dollars or five million.
Why Most Plans to Justify Maintenance Budget Increases Stall Out
Three patterns show up almost every time. The plan reads like a wish list of equipment and headcount with no return attached. Downtime cost figures come from rough estimates, so finance discounts them by half or more. And the maintenance team owns the problem alone, with no operations or finance signatures backing the case.
Plant managers usually approve initiatives that other departments also endorse. A reliability investment with three signatures (maintenance, operations, finance) is usually stronger than a maintenance-only request, even when the dollar amount is identical.
A signature from operations turns a maintenance budget request into a cross-functional strategy. That single line item can carry more weight than the executive summary.
The fastest way to earn an operations signature is to frame your ask in terms of throughput. Operations leaders care about output per shift. If your program protects that number, walk them through the math before you walk it to finance.
Production managers also have their own funding battles. A request that helps them hit production targets becomes a request they actively want to advocate for.
Use Real Downtime Data Over Industry Averages
Industry benchmark numbers are useful for context but fragile in budget meetings. When a finance team sees a generic downtime-cost average, they will usually ask whether that number reflects your plant, your margin, your constraints, and your actual failure history.
Pull six months of your CMMS work-order history instead. For each unplanned shutdown, calculate the cost across four lines:
- Direct labor cost (overtime, contractor hours, callout fees)
- Lost production margin (units missed multiplied by contribution margin)
- Scrap and quality cost from the restart
- Schedule attainment penalty (missed orders, expedited freight, customer credits)
Tally the total. If CMMS data is thin, run the analysis on the worst five events of the year. Five documented events usually carry more weight than one industry average.
Build a Business Case to Justify Maintenance Budget Increases
The structure that works has five parts. Current state shows the top three failure modes, frequency, and 12-month cost. Proposed state shows the same failures reduced by a specific percentage, with a tactic per failure. Investment lists dollars, headcount, parts, and training line by line. Payback period should be calculated from site-specific downtime, repair, labor, and production-loss data. And the risk-if-not-funded section explains the continuation of current losses plus expected escalation.
Each of the five parts can fit on one page. A 12-page maintenance proposal can get skimmed. A shorter proposal with five tight sections is more likely to be read. Brevity is a discipline that pays off in approval rates.
Stay specific. Vague language gets cut from budgets first. “Improve condition monitoring coverage” reads as filler. “Add 12 wireless vibration sensors on critical pumps in Building C, with expected risk reduction tied to the last 18 months of pump failure data” reads as fundable.
Specificity survives every budget review. Every line item should name an asset, a tactic, and a number.
Specificity has another benefit. When the numbers do pan out, the team can point to exactly which line item delivered the win. A program built on vague language has no record to defend the next year.
Reliability engineers who anchor every claim in measured data give finance a stronger basis to approve line items they might otherwise red-pen. Trust compounds across budget cycles.
Tie the Ask to Metrics Leadership Already Tracks
Most plant scorecards already include uptime, throughput, scrap rate, and overtime. Map your investment to those four numbers. When you can show how each investment is expected to influence a number leadership already reports, the conversation shifts from “we need money” to “this is how we improve the scorecard.”
Some examples of metric mapping help illustrate the move:
- Condition monitoring on critical assets can reduce unplanned downtime, which supports higher uptime percentage
- Spare parts kitting and staging can reduce wrench time loss, which can lower overtime ratio
- Precision alignment tools and training can reduce premature bearing wear, which supports higher mean time between failures
Reliability engineers who translate technical wins into plant scorecard wins get funded. Those who stay in maintenance language tend to stay underfunded.
That translation work takes practice. When a maintenance leader brings a clean ROI calculation into a finance review, the discussion becomes easier to evaluate and defend. That is where reliability starts earning a stronger seat at the planning table.
Skip the Fear Pitch
Fear-based budget requests may get attention once or twice. After that they become background noise. A plant manager who has been told the boiler is “about to fail” three years running stops listening on year four.
The stronger play is opportunity framing. Show what becomes possible when the program is funded. More throughput. Lower overtime. Better safety performance. Higher return on net assets. Frame the ask as a path to better numbers, with catastrophe avoidance baked in as a secondary benefit.
Opportunity framing keeps every budget meeting forward-looking. Reliability becomes a growth lever, with risk reduction as the bonus.
This matters because reliability programs typically need year-over-year investment to compound their gains. Building the habit of opportunity framing in year one earns trust for year three and year five. The leaders who repeatedly justify maintenance budget increases tend to be the ones who repeatedly demonstrate value.
The same logic applies to the language used in alarm reports, daily standups, and incident reviews. Conversations that lead with consequences train finance to tune out. Conversations that lead with value train finance to lean in.
Plant managers who hear opportunity-framed pitches start including reliability in capital planning conversations earlier in the cycle. That position alone is worth more than any single approval.
Three Tactical Moves That Strengthen Every Maintenance Budget Request
The three highest-leverage moves require little or no direct capital:
- Co-sign with operations. Get a production manager to put their name on the document. Their fingerprints change how finance reads it.
- Show your work. Attach work-order pulls, downtime logs, and assumptions in an appendix. Finance teams may review appendices when they test assumptions, so clean source data removes one of the easiest lines of attack.
- Pre-sell the request. Walk the proposal through the controller, the plant manager, and any director who will be in the room before the meeting. Surprises often hurt approval. Pre-socialized requests are easier to defend.
None of these moves require new tools or new headcount. They take time and relationship work. Reliability leaders who invest that time tend to walk out of budget meetings with the line items they came in to defend.
When the Answer is Still No
Budget approval rarely happens on the first try. A no in March often becomes a yes in October if the team uses the intervening months well. Track every failure event that the unfunded program could plausibly have reduced or prevented. Build the case file. Bring it back in the next cycle with fresh data.
Use the time productively. Add cost detail. Add named asset examples. Add the most recent failure event tied to the unfunded scope. Each iteration sharpens the case until the data becomes more compelling or the situation changes.
The reliability programs that win sustained funding share one habit. They treat every budget cycle as a chance to refine the argument, the data, and the relationship with finance. Plants where maintenance and finance see each other as adversaries tend to stay underfunded. Plants where the two functions trade data weekly tend to get approved.
Every denied request is a draft. The next twelve months are the rewrite.
Treating denial as a draft pulls the emotion out of the room. The team stops feeling rejected. Finance stops feeling besieged. Everyone gets back to the data.
The Bottom Line on Justifying Maintenance Budget Increases
Strategy without funding stays on the whiteboard. To justify maintenance budget increases consistently, lead with measured downtime cost, tie the ask to scorecard metrics, line up cross-functional signatures, and build the case file year over year. The plan is the easy part. The budget is the hard part. Leaders who learn to build the financial case are more likely to get the chance to run the plan.