

Air is inert, so it shouldn’t affect your oil, right?! This is a concept that many people get wrong or don’t fully understand. Air in your oil can literally cost your facility millions of dollars in damage if it is not treated or removed from your system early.
It can affect the compressibility of your oil, its thermal behavior, and the oxidation stability of hydraulic and drivetrain systems, leading to degradation or efficiency loss. With reduced efficiency, overall production will decline, which can negatively impact the profitability of your operations. Before we dive into the ways it can affect your system, we need to understand the basics.
The Four States of Air in Oil
Air can exist in four states within your oil and machine. As shown in Figure 1, these include;
- Dissolved air
- Entrained air
- Foam
- Headspace interaction
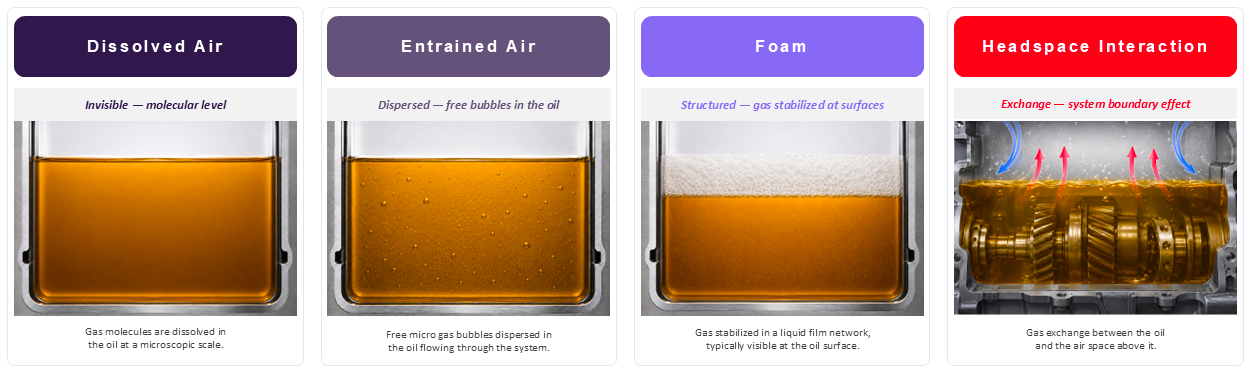
Figure 1: Different states in which air exists in your system
Each of these states can affect your system differently, as shown in the table below, and will have corresponding sources of ingression.
| State | Reliability Meaning | Typical Sources |
|---|---|---|
| Dissolved Air |
|
Equilibrium with headspace air usually occurs in the sump, make-up oil, storage, temperature changes, or pressure changes. |
| Entrained Air |
|
Suction leakage, vortexing, return-line splash, churning, gear mesh aeration, and system design. Strong pressure reductions can also lead to deaeration of dissolved air. |
| Foam |
|
Surface-active additives, detergents, contaminants, high turbulence, and agitation. |
| Headspace Interaction | Drives how much air enters or leaves the oil over time. Influenced by temperature, pressure, ventilation, and oil level. | Breathers, vents, temperature cycles, pressure changes, and low oil level. |
For each of the states above, air affects the reliability of your equipment. It is critical to identify the state of air in your oil so it can be removed before it begins to affect your system. Typically, maintenance teams pay attention to air in oil only when it is visible (foaming) or when it demands their attention through noisy interactions. By this time, teams have lost the opportunity to remove the air while it is in its more benign state.
How Does Air Get Into Oil?
When we think about air getting into our oil, we generally think of openings or mechanical areas that allow it to enter. However, air can enter our system in several ways. It is also worth noting that air already exists in the oil at equilibrium, where it will leave the oil according to Henry´s law.
Air can become entrained (or trapped) in the oil through various mechanisms such as return-line splash, vortex formation, suction-side leakage, tank dynamics, free-surface interaction, or churning in gearboxes and drivetrains. When entrained, it can cause damage to your equipment if not detected in time.
Changes in operating regimes can also influence whether air stays in the oil or gets forced into it. This is usually seen with changes in pressure, temperature, or shear conditions. Within your system, your oil can experience a load transition, a change in oil level, or return flow, all of which can influence the volume of air that remains in or enters your oil.
Even after identifying the source of air ingress, it is imperative that it be removed from your system. While air in oil does not usually get the attention it deserves, it will demand that attention if it goes unresolved or remains in your system.
The Chemistry Behind Air in Oil
The oil’s chemistry also plays a significant role in determining its air content. All finished lubricants consist of base oil and additives. The characteristics of your base oil can determine important factors such as your viscosity, interfacial behavior, density, and gas solubility. The surface tension of your oil can also be affected by the size of the bubbles and how long they stay in that formation of the bubble.
Depending on the oil application, the appropriate ratios and types of additives vary. As such, there may be more emphasis on certain characteristics such as oxidation stability, viscosity behavior, or foam control. These additives all affect how long air can remain in the oil and the oil’s state, which can affect our machinery.
As shown in the video below, we can compare the air content percentage of an oil at varying temperatures and observe significant differences.
As shown in the first video, for a wind turbine gearbox using Optigear Syn CT320, the oil contains less air as the temperature increases, decreasing from 2% at 80°C to 0.7% at 110°C. At 110°C, we see a further decrease in air content to 0.65%. As the temperature starts decreasing again toward 80°C, we observe a volume with 2.2% air content in the oil. This is simply due to a temperature change in the oil, not to any additional air ingress.
As such, for the Optigear Syn CT320 oil in this wind turbine gearbox application, we can conclude that if the oil operates at temperatures around 80°C, we can expect up to 2% air volume in the oil. We observe that for lower temperatures, the air content may increase due to the impact of viscosity on air-release capability.
But if the temperatures increase (to a temperature that is tolerated within the system), then the volume of air will decrease, which is a good thing. However, as temperature increases, your chances of thermal and non-thermal oxidation also increase.
In the video above, we see a completely different behavior with the Fuchs Titan EG ATF D VI oil in an automotive gearbox, which starts off at 45 °C. There is a low air volume in the oil at 0.1%. However, when the temperature reaches 73°C, the volume of air increases by 0.7%.
The air bubbles are much larger, increasing the contact surface and their count within the oil. As the temperature decreases to 49°C, the volume decreases by 0.4%, and the number of bubbles decreases. With the continued drop in temperature to 44°C, the air volume decreases to 0.2% and then tapers off to 0.1%, with smaller, fewer bubbles.
In a wind turbine gearbox application using industrial gearbox oil, we observe that the air content decreases as temperature increases. Conversely, in an automotive gearbox using transmission gear oil, the air content increases with rising temperatures. This is very specific to the oils tested in these examples, as different oils will have varying ratios and types of additives and base oils, which can be affected in diverse ways.
The chemistry of the oil is, therefore, another critical part of understanding the air in your oil. If this is properly understood and measured, it can be very useful for monitoring your oil’s health in the field.
How Is Air in Oil Measured?
When we think about measuring air in oil, the top-of-mind lab tests that are well known are the foam test (ASTM D892) and the Air Release test (ASTM D3427 & DIN ISO 9120). While these two tests can provide information on the tendency of foam to dissipate or for air to be released from the oil, they don’t give the entire story of what’s happening in the oil as it relates to air.
More specifically, they do not take into account the volume of air that can be trapped in your system during operation, nor how long it will take to dissipate when everything stands still. These parameters are critical for determining the impact of entrapped air in your oil.
People can also measure the volume of air in the oil, but 5% can mean different things depending on the air’s state, as shown in Figure 2 below.
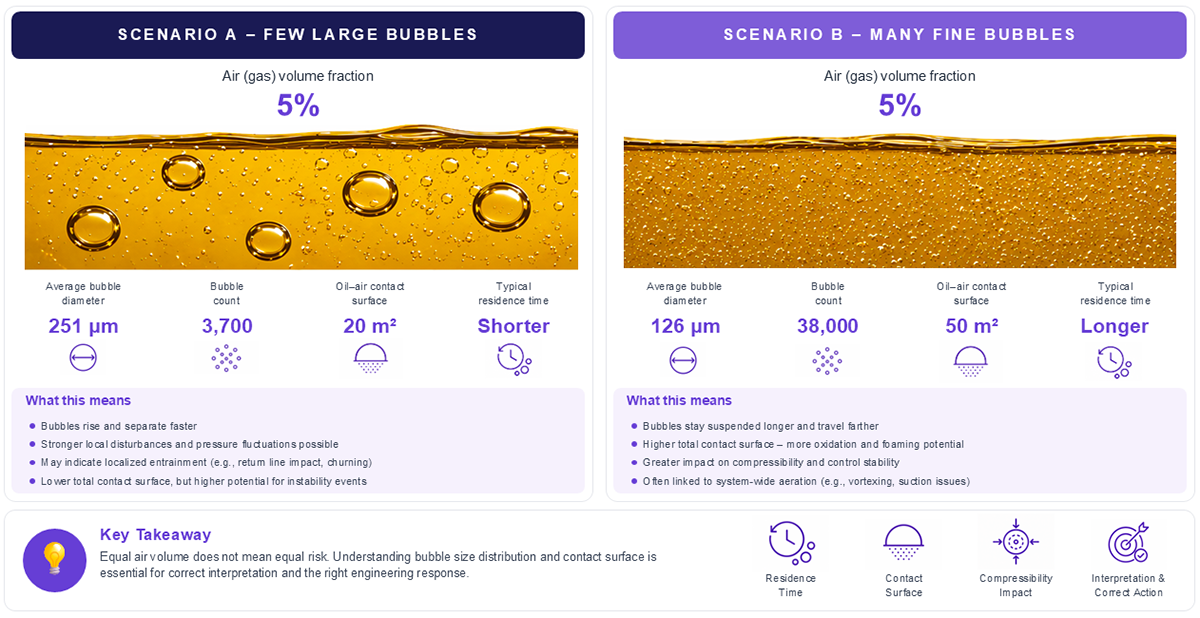
Figure 2: Scenarios where the air (gas) volume of 5% can mean different things
As we can see in Figure 2, an air (gas) volume fraction of 5% may appear the same, but it can affect your system differently.
In Scenario A, the bubble sizes are larger, so these will rise to the surface more quickly and dissipate. As such, there are fewer disturbances and pressure fluctuations.
In this case, these might indicate localized entrainment, suggesting churning or impact from your return line. Another source could be coalescence, driven by oil properties, splash effects, and other factors. The risk of air bubbles becoming trapped in dead zones increases.
However, in Scenario B, the average bubble size is smaller, which means there are many more air bubbles in the oil! This means that there is a higher surface contact area and an increased potential for foaming. This can increase the rate of oxidation and, by extension, the risk of the oil forming varnish.
This also significantly affects the oil’s compressibility. With the advent of these smaller bubbles, there is usually system-wide aeration, such as vortexing or suction issues. The risk of inefficient cooling and overheating your oil in heaters has increased significantly.
With only a 5% air volume result, we would be missing critical information, such as what could be causing the issue or whether it is an immediate threat to our operations. This is where the SBS (Smart Bubble System) changes the entire game.
Turning Air Measurements Into Reliability Insight
The Smart Bubble System, developed by Evamo, allows users to gain deeper insight into the behavior of air in their oil. It turns a general volume-based quantification into actionable metrics to improve your system’s reliability and performance. The SBS captures the following metrics:
- Bubble diameter
- Air content in your system
- Bubble count
- Bubble size-distribution
- Oil-Air contact surface
- Transient bubble events
These metrics are directly related to what users see in the field. As such, it closes a gap that many users often experience when relating lab results to field integrations. Users can also trend whether the number of smaller bubbles increased, whether large bubbles began to form in their system, or whether there were transient spikes due to particular conditions in temperature, load, speed, or even return-flow conditions.
Here are a couple of examples that highlight how these values can be interpreted in the field:
- If a rise in fine-dispersed bubbles occurs, then this can be indicative of persistent gas transport through the system. This affects the oil’s compressibility and can even lead to a stability issue.
- If there is a rise in the number of larger bubbles, this can indicate that there is localized entrainment, return-line impact, free-surface interaction, and stronger ingestion events. If these are not addressed in time, they can damage your components.
- If one detects an increase in oil-air contact surface, this can indicate that gas distribution has become more degradation-relevant in the system. This may be despite no dramatic change in the total air content.
- If transient bubble events are present, this can directly point to issues related to specific operating states rather than a general system condition that needs to be addressed.
- If smaller bubbles occur, this leads to much worse thermal conductivity. As such, higher operating temperatures would need to be cooled down directly with a high amount of energy, or this can lead to a much higher thermal oxidation rate. In each case, the system efficiency is reduced.
These observations set the stage for more in-depth analysis and contextual interpretation to determine whether the pattern is fluid-driven, hardware-driven, or operating-point-driven. A workflow can be easily implemented to reduce risks to your operation, as highlighted in Figure 3 below.

Figure 3: Suggested workflow for monitoring air in your oil
A robust methodology for the characterization and optimization of your system should follow a structured measurement and interpretation workflow:
- Definition of the System Baseline
The first step is to establish a representative baseline condition by continuously measuring the system’s actual operating state. These parameters should include temperature, rotational speed, torque, flow velocity, pressure conditions, and load states. The baseline must capture the dependency of the oil–air behavior on these operating variables to provide a reliable reference for subsequent evaluations and further steps. - Detection of Deviations and Dynamic Transitions
Deviations from the baseline are identified using real-time monitoring metrics and transient analysis. Changes in aeration behavior, bubble content, or flow characteristics are quantified relative to the reference baseline state established in Step 1. In parallel, a prioritization strategy should be defined to identify the most critical deviations and focus optimization efforts on the parameters with the highest system impact. - Contextual Interpretation of Deviations
Detected deviations must be interpreted within the system’s physical context. The origin of the observed behavior should be determined by correlating the measured size distribution and temporal system response with potential mechanisms such as splashing, churning, vortex formation, temperature variations, fluid aging, or changes in the operating point. This contextual analysis enables the differentiation between transient operational effects and systematic design-related issues. - Implementation of Targeted Corrective Measures
Based on the contextual interpretation, focused and goal-oriented design modifications can be implemented. Possible optimization measures include adjustments to return-flow geometries, improvements in suction conditions, reductions in churning effects, optimization of pressure levels, speed or load adaptations, fluid conditioning, changes to additive formulations, or enhanced filtration strategies. The corrective actions should directly address the identified root causes of the aeration behavior. - Validation Through Continuous Measurement and Improvement
The effectiveness of the implemented measures must be validated through continuous monitoring and iterative evaluation. Repeated measurements under comparable operating conditions ensure that improvements are sustainable and quantifiable. This closed-loop approach enables continuous system refinement and supports long-term optimization of the behavior of oil–air mixtures.
By moving beyond the standard quantitative measure of air in oil, we can address critical issues occurring in our equipment. By measuring and interpreting metrics correctly, you can optimize your system’s overall performance, make it goal-oriented, and keep it focused. This supersedes the often-used trial-and-error approach, which can ultimately damage your equipment.
For those interested in taking a more serious approach to understanding the health of their oil and preventing issues before they occur, the SBS can help improve the reliability of their system.
What you see is what you get!