
Somebody, somewhere, is right now putting “36% of bearing failures are caused by lubrication” on a slide. The number is real. The slide is probably wrong.
Bearing failure statistics get quoted constantly, usually stripped of the one thing that makes them mean anything: scope. The famous 36% is a share of premature failures, not all bearings. The often-repeated “80% are lubrication-related” claim uses a much wider definition. Those two framings can coexist, but only if you state the scope.
This is a compiled reference for the bearing failure numbers people cite, where they come from, and how to use them without getting corrected by the reliability engineer in the room.
The Numbers Everyone Quotes
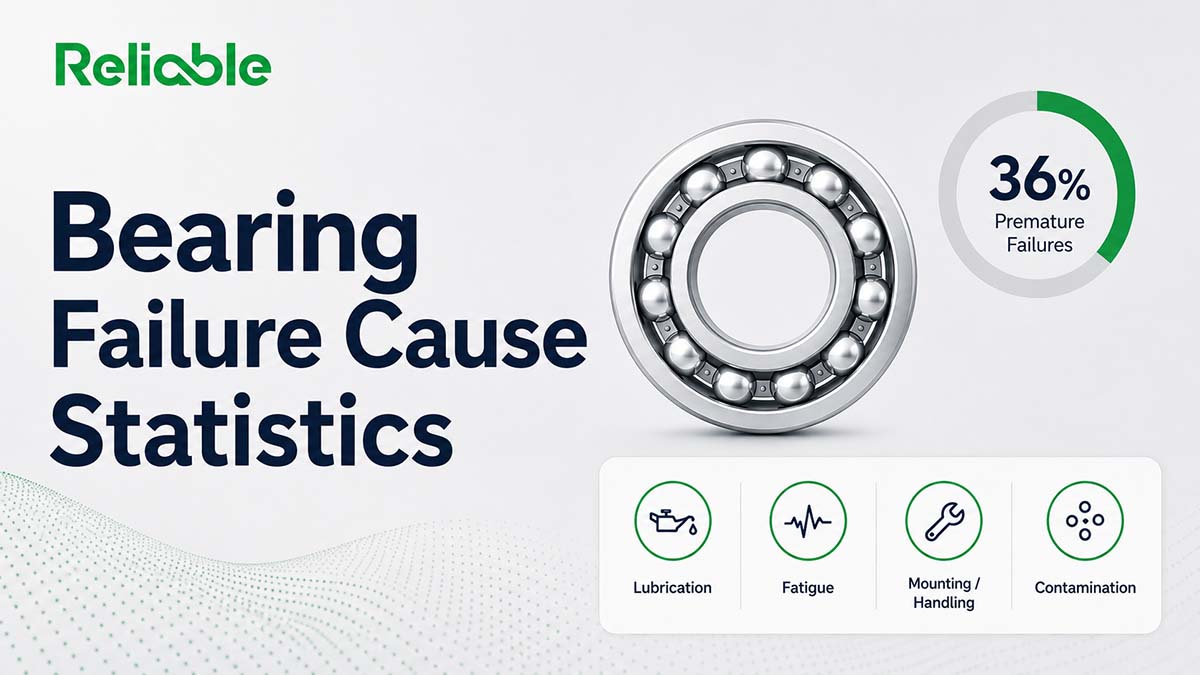
The most-cited breakdown comes from SKF, one of the world’s largest bearing makers. In its bearing failure training, SKF splits premature bearing failures into lubrication at 36%, fatigue at 34%, mounting and handling at 16%, and contamination at 14%.
That’s the source of the “36% lubrication” stat. Here’s the catch almost everyone drops: these are shares of premature failures, the bearings that die before their time. SKF also teaches that most bearings, on the order of 90%, outlive the machine they’re installed in.
So 36% doesn’t mean “36% of all bearings.” It means 36% of the minority that fail early. Quote it the first way and a bearing engineer will stop listening.
Bearing Failure Cause Statistics: The Sources
Reliable Confidence Score: how safely each figure can be used in a maintenance and reliability discussion, based on source quality, how clearly it defines scope, and how often the number gets misquoted.
Reliable Confidence Score: how safely each figure can be used in a maintenance and reliability discussion, based on source quality, how clearly it defines scope, and how often the number gets misquoted.
| Source | Figure | Reliable Confidence | Notes |
|---|---|---|---|
| SKF, bearing failure training | Premature failures split: lubrication 36%, fatigue 34%, mounting and handling 16%, contamination 14% | Highbut read the scope | The most-cited breakdown. These are shares of premature failures, not all bearings. Treat the four numbers as one set from one maker. |
| SKF, bearing-life teaching | Roughly 90% of bearings outlive the equipment they’re installed in | High | The counterweight to the scary percentages. Only a minority of bearings fail early, and the 36/34/16/14 split lives inside that minority. |
| Tribology and lubrication-engineering literature | Lubrication-related causes framed in some literature as a majority of failures, with claims cited as high as 80% (one breakdown: lubrication about 80%, selection 10%, mounting 5%, other about 5%) | Lowscope-dependent | A much wider definition that folds in lubricant contamination, selection, application, and degradation. Useful for showing the spread between sources, not for quoting as a settled number. |
| ISO 15243:2017 | Six failure modes, no percentages | Highframework only | The international standard classifies bearing damage (fatigue, wear, corrosion, electrical erosion, plastic deformation, cracking) but assigns no percentages. Subsurface rolling contact fatigue is the normal life-limiting mode; many other modes point to causes a reliability program can influence. |
| Cantley water-in-oil study (1977) | Water at 100 to 400 ppm measurably cut tapered roller bearing fatigue life; free or emulsified water can cut bearing life by roughly half | Medium | A foundational full-scale bearing test. Small amounts of water do outsized damage, which is part of why contamination and lubrication overlap. |
| “Reach design life” claim | As few as 10% of bearings reach their full L10 design life | Low | An expert estimate repeated widely. Directional at best, and it answers a different question than SKF’s “outlive the machine.” |
The Big Takeaway
The 36% and the 80% can both make sense, but only with the scope stated. They answer different questions.
SKF’s 36% counts lubrication as one defined cause category among four. The broader 60% to 80% lubrication-related framing counts everything the lubricant touches: wrong lubricant, wrong amount, wrong interval, lubricant contamination, lubricant degradation, and some lubrication-driven wear or fatigue.
If your definition treats lubricant contamination as lubrication-related, SKF’s split already rises from 36% to about 50%. If it also captures lubrication-driven wear and fatigue, the higher 60% to 80% claims become easier to understand. Same general problem, wider net.
The 36% and the 80% can describe overlapping failure territory when lubrication is defined differently.
Pick the framing that fits your audience, and say which one you’re using.
Why the Percentages Disagree
Three things move these numbers.
Scope of “lubrication.” The single biggest driver. A narrow definition (wrong lubricant, wrong amount, or wrong interval) gives you SKF’s 36%. A wide one (anything involving lubricant selection, application, contamination, degradation, or the oil film) can support the higher lubrication-related figures.
Premature versus all failures. Most published splits describe early failures only. They say nothing about the large majority of bearings that quietly reach retirement with the machine.
Who’s counting. Bearing makers, lubrication companies, and academic studies each see a different slice of the world, and each carries a natural emphasis. The numbers drift accordingly.
It’s worth knowing that the authoritative technical standard, ISO 15243, refuses to play this game. It classifies bearing damage into six modes (fatigue, wear, corrosion, electrical erosion, plastic deformation, and cracking) and assigns no percentages at all. Subsurface rolling contact fatigue is the normal life-limiting mode. Many other modes point to operating, lubrication, contamination, electrical, handling, storage, or mounting causes that a reliability program can influence.
How to Use These Numbers
Use the statistics to make one argument: most premature bearing failures are preventable.
That’s the durable takeaway across the cited sources. Whether lubrication is framed as 36% or 60% to 80%, and whether you add installation and contamination, a large share of early bearing damage traces to things a good program controls. True fatigue exists, but it should not be used to excuse preventable lubrication, contamination, handling, storage, or mounting problems.
When you cite a number, name its source and scope. “SKF attributes 36% of premature failures to lubrication” will hold up. “Lubrication causes 80% of bearing failures” needs the wider definition stated, or someone will challenge it.
Most premature bearing failures are preventable. That is the point the cited data supports.
Then point the numbers at action. Lubrication, contamination control, and proper installation are the recurring preventable buckets across the cited breakdowns. That’s where a reliability program earns its keep.
Where Teams Go Wrong
A few moves get a bearing-failure claim torn apart.
First, dropping the word “premature.” Saying “36% of bearings fail from lubrication” badly overstates the claim, because most bearings do not fail early at all. The accurate version is “36% of premature failures.”
Second, treating one manufacturer’s split as universal. SKF’s 36/34/16/14 is SKF’s data. Other makers and studies report different numbers, and the split shifts by industry. Pulp and paper looks nothing like a clean assembly plant.
Third, stacking framings. Quoting SKF’s 36% lubrication category and then adding a broader 80% lubrication-related claim in the same breath double-counts and confuses people. Pick one circle around “lubrication.”
Fourth, using L10 claims loosely. “Only 10% of bearings reach their design life” is a provocative line, but it’s an expert estimate rather than a controlled study, and it answers a different question than how bearings actually fail.
Methodology
This article separates well-attributed bearing failure figures from the looser ones.
The 36/34/16/14 breakdown comes from SKF’s own bearing failure training materials, and it describes premature failures specifically. The six-mode failure classification comes from ISO 15243:2017, which defines damage modes but assigns no cause percentages.
The broader lubrication-related figures, cited as high as 80%, come from the tribology and lubrication-engineering literature, and depend heavily on how broadly “lubrication-related” is defined. The water-in-oil figures come from full-scale bearing fatigue testing first published by Cantley in 1977.
Figures that trace to a single expert estimate or a single study, including the L10 “reach design life” claims, are rated lower and flagged as directional. Where a figure describes premature failures rather than all bearings, that scope is stated.
Bottom Line
The exact percentages matter less than the pattern, and the pattern is consistent: most premature bearing failures are preventable, and lubrication sits at or near the top of the percentage breakdowns cited here.
Cite the 36% when you mean SKF’s defined lubrication category for premature failures. Cite the 60% to 80% when you mean the broader lubrication-related framing. Just name which one, and never drop the word “premature” when you are using SKF’s split.
Get those right, and the statistics make your case. Get them wrong, and they hand the skeptic in the room an easy win.
Sources
- SKF, “Bearing Damage and Failure Analysis” (SKF presentation, STLE, November 2019), premature bearing failure statistics: https://torontostle.com/wp-content/uploads/2021/03/SKF-Bearing-Damage-Failure-Analysis-D-Devalia-SKF-STLE-Nov-2019.pdf
- SKF’s “Bearing Damage and Failure Analysis” Handbook: https://cdn.skfmediahub.skf.com/api/public/093168a92d25cc46/pdf_preview_medium/093168a92d25cc46_pdf_preview_medium.pdf
- ISO 15243:2017, “Rolling bearings: Damage and failures: Terms, characteristics and causes”: https://www.iso.org/standard/59619.html
- BEARING NEWS, “The Most Common Causes of Bearing Failure and the Importance of Bearing Lubrication” (tribology breakdown): https://www.bearing-news.com/the-most-common-causes-of-bearing-failure-and-the-importance-of-bearing-lubrication/
- E. Cantley, “The Effect of Water in Lubricating Oil on Bearing Fatigue Life,” ASLE Transactions, Vol. 20, No. 3, pp. 244–248 (1977): https://www.tandfonline.com/doi/abs/10.1080/05698197708982838
- Wind Systems Magazine, “Excessive Water in Gear Oil Shortens Bearing Life” (explains the Cantley water-life relationship): https://www.windsystemsmag.com/excessive-water-in-gear-oil-shortens-bearing-life/