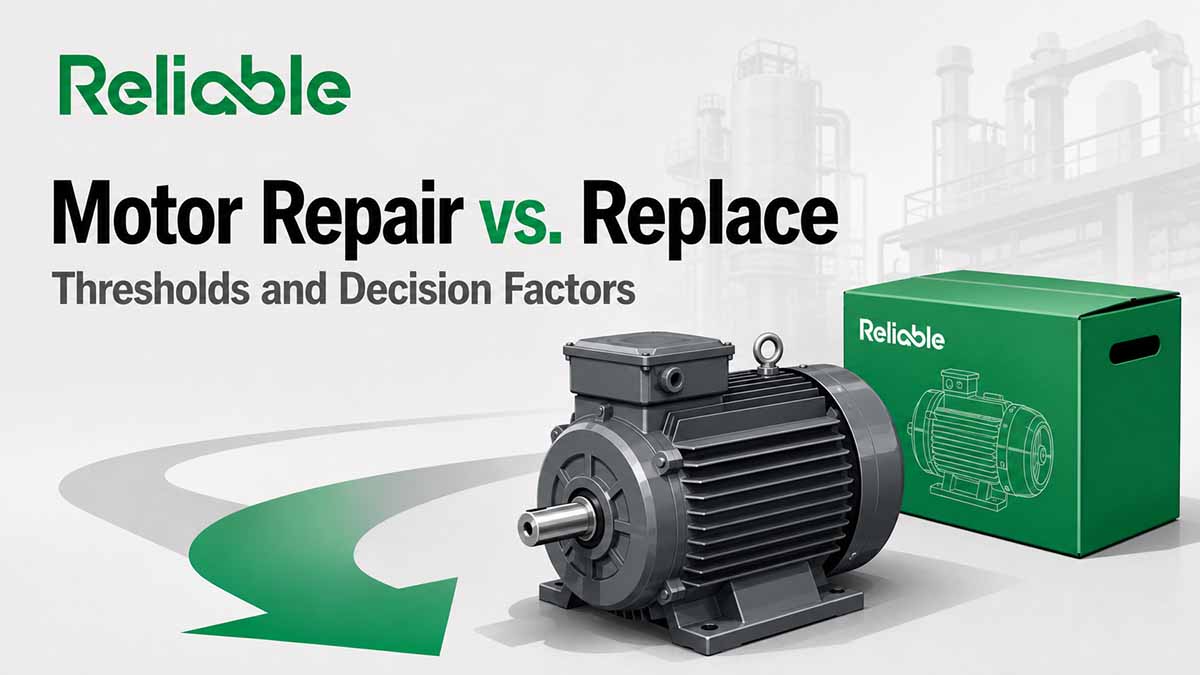

The short version: There is no universal horsepower at which a failed motor stops being worth repairing. The number most plants are looking for is a calculated output, not a published constant: DOE and Advanced Energy both frame it as a horsepower breakpoint derived from your electric rate, annual run hours, payback requirement, motor load, and supplier discount. Two facilities running identical motors can land on breakpoints of 10 hp and 60 hp. Layered on top of that is a repair-cost ratio (Advanced Energy’s decision tree uses 60 percent of a new motor’s price) and a set of non-financial factors that routinely override both, starting with downtime. The old belief that rewinding permanently costs a point or two of efficiency is the one contested item inside this decision, and it is scored below.
The motor repair vs replace decision comes down to three separate thresholds that often get treated as one. This page compiles what DOE, EASA, and Advanced Energy publish on each, along with the one contested claim that sits inside the decision.
Three different thresholds in the motor repair vs replace decision
Ask three maintenance managers where the repair-versus-replace line sits and you will get three kinds of answer. They are answering different questions.
The horsepower breakpoint is the motor size above which repair wins and below which replacement wins, for a specific facility. It comes out of a payback calculation, so it moves with electricity price, run hours, and capital policy.
The repair-cost ratio is the percentage of a new motor’s price at which a quoted repair stops making sense. It is applied per repair, after the shop has looked at the machine.
The condition thresholds are the technical limits inside the repair itself: how much the stator core loss can rise before the core needs attention, and what burnout temperature keeps the core intact. These decide whether a good repair is available at all.
A complete policy uses all three. Most published rules of thumb use one and imply it is the whole answer.
The horsepower breakpoint
Advanced Energy’s Horsepower Bulletin is the clearest published treatment. It defines the horsepower breakpoint as the horsepower rating above which motors should be repaired and below which motors should be replaced with a new motor, and it is explicit that the curve depends on each facility’s operating conditions. The bulletin covers AC induction motors, NEMA Designs A and B, 1 hp to 500 hp, at 1,200, 1,800, and 3,600 RPM. It excludes non-NEMA, multi-speed, DC, 900 RPM, NEMA Designs C and D, and special purpose machines.
Four inputs produce the curve:
| Input | What it is | Where to get it |
|---|---|---|
| Average electric rate | Total 12-month electric cost (energy, demand, fees) divided by total kWh | Your own bills, not a published state average |
| Maximum acceptable payback | Company hurdle, commonly two years, sometimes up to ten for efficiency or reliability projects | Finance or capital policy |
| Motor supplier discount | Discount off list price under your purchasing contract | Purchasing or your distributor |
| Average motor load | Load as a percent of nameplate; often assumed at 75 percent, with a real range from under 25 percent to 125 percent | Amp readings against nameplate, or measured watts |
The bulletin’s own worked example shows how wide the spread gets. Two plants, both running three shifts (6,200 hours), both on a two-year payback, both with a 40 percent supplier discount and 75 percent average load, differ only in electric rate. At $0.04 per kWh, the breakpoints are 25 hp and below for 1,800 RPM ODP motors and 10 hp and below for TEFC. At $0.12 per kWh, the same analysis returns 250 hp and below for ODP and 60 hp and below for TEFC. The TEFC breakpoint moves by a factor of six on electric rate alone.
That is the reason a single published horsepower number does not travel. It also explains why plant-level rules of thumb (“anything under 50 hp gets replaced”) tend to be locally correct and generally wrong.
What DOE says about size
DOE’s Improving Motor and Drive System Performance: A Sourcebook for Industry takes a narrower position and states it plainly. For small general purpose motors, 15 hp and below, buying a new premium efficiency replacement may cost less than repairing. Comparing initial costs alone, the sourcebook says repair is usually cheaper for larger motors.
The sourcebook then argues against deciding on initial cost at all. Its illustration: a 100 hp motor at 94.5 percent efficiency, 6,300 hours a year for 18 years at $0.075 per kWh, spends roughly 95 percent of its lifetime cost on electricity, with purchase and repair together accounting for about 5 percent. Advanced Energy runs the same argument on a 75 hp motor and reaches 97 percent.
Those exact ratios depend on the assumed rate and hours, and both examples use mid-2010s electricity prices. The structural point survives the assumptions: the purchase-versus-repair delta is a small fraction of what the machine will cost you, and an efficiency difference that looks trivial on a spec sheet is not trivial across a service life. For scale, DOE’s June 2023 electric motors rule used an estimated average motor lifetime of 13.6 years in its life-cycle cost analysis, which is a modeling input for a national shipments analysis rather than a measured service life for any particular machine.
The repair-cost ratio
Advanced Energy’s decision tree runs four tests in sequence when a motor fails:
- Is the horsepower at or below your breakpoint for replacement with a NEMA Premium motor? If yes, replace with NEMA Premium.
- Will the repair cost more than 60 percent of a new NEMA Premium motor? If yes, replace with NEMA Premium.
- Is the horsepower at or below your breakpoint for replacement with an energy-efficient motor? If yes, replace with an energy-efficient motor.
- Will the repair cost more than 60 percent of a new energy-efficient motor? If yes, replace. If no, send the motor for repair.
The 60 percent figure in that tree is a documented published cost ratio attached to a stated decision procedure. Wider ranges circulate in the trade: motor service centers publish guidance in the 50 to 80 percent band, and a “60 percent rule” appears widely in repair-shop marketing. Those shop figures are commercial guidance from firms with a stake in the outcome, in either direction, and they are not backed by published analysis. Use 60 percent as a documented starting point, verify against your own breakpoint math, and treat any single percentage as a screening device rather than a decision.
One threshold in the bulletin sidesteps the cost ratio entirely. Where the cost of downtime per hour exceeds twice the purchase price of a new motor, the recommendation is to buy new and install it at the earliest scheduled outage, replace on a regular cycle (roughly every two to five years), and keep a dedicated spare.
The factors that override the arithmetic
EASA and DOE’s joint A Guide to AC Motor Repair and Replacement, produced under DOE’s Motor Challenge Program, is direct about which factor usually decides: production downtime. Its full list, alongside DOE’s Motor Repair Tech Brief list, covers the same ground.
| Factor | Why it moves the decision |
|---|---|
| Downtime | Lost production usually dwarfs the price difference between repair and replacement |
| Availability | A repair you can start today beats a replacement you cannot get for six weeks, and the reverse |
| Efficiency of both options | Drives the payback calculation; see the formulas below |
| Special electrical or mechanical features | Purpose-built machines are often well matched to the application and are usually repaired |
| Application fit | A failure is a chance to correct an oversized, miscooled, or mis-specified motor rather than reinstate it |
| Age and repair history | Repeat failures point at root cause, not at the motor. See our electric motor failure statistics page for what the major surveys found |
| Mounting and installation changes | A different frame, speed, or hp may require new wiring, mounts, sheaves, or belts |
| Salvage value of the existing motor | Reduces the effective cost of replacing |
| Budget structure | Many plants budget repairs to maintenance and purchases to capital, which distorts sound decisions |
That last row deserves emphasis, because it is an organizational problem wearing a technical costume. Advanced Energy names it directly: capital approval procedure can push facilities into repeated repairs when many plants have an annual maintenance budget that covers repair but not new motor purchases.
On the downtime input itself, the figure that belongs in the calculation is your own hourly cost of the stopped line rather than a published average. Our cost of unplanned downtime and unplanned downtime frequency benchmarks pages cover where the circulating numbers come from and how far they can be trusted.
Availability figures need re-checking locally
The EASA and DOE guide’s availability guidance is worth reading with its 1999 publication date in view. It reports repairs of 1 to 200 hp motors typically taking three to five working days, general-purpose ODP and TEFC motors under 100 hp commonly held as stock items, rush orders for 100 to 500 hp general purpose motors often delivered in two to four days, and special or over-500 hp machines taking several weeks. Those are reasonable structural expectations. They are not current market data, and industrial electrical equipment lead times have moved substantially since. Get a delivery commitment from your supplier and a turnaround commitment from your service center at the time of the decision, and build the policy around what they will commit to rather than what a reference document reported.
The energy math
Both authoritative sources publish the same calculation in slightly different notation. DOE’s Motor Repair Tech Brief:
kW saved = hp × L × 0.746 × (1/Eexisting − 1/Enew)
Total electric dollar savings = (kW saved × 12 × monthly demand charge) + (kW saved × annual operating hours × kWh rate)
Here hp is nameplate horsepower, L is load as a fraction of full rated load, Eexisting is the efficiency of the existing motor after repair, and Enew is the efficiency of the replacement.
EASA’s guide adds the payback:
Simple payback = (new motor cost + incremental installation cost − rewind/repair cost − utility rebate) ÷ (energy charge savings + demand charge savings)
Three cautions on inputs. Load is difficult to measure in the field, and 0.75 is the conventional substitute. Running time means hours the motor actually runs, not process hours. And for centrifugal loads, full-load speed matters: DOE notes that premium efficiency motors tend to run at slightly higher speed than the standard-efficiency machines they replace, and that a 10 RPM increase from 1,760 to 1,770 RPM can raise the load on the motor by up to about 1.6 percent, with a 20 RPM increase raising load and consumption by about 3.3 percent, which can cancel the expected savings. Specify a replacement with full-load speed equal to or slightly below the motor it replaces.
Scored claim: rewinding a motor costs you 1 to 2 percentage points of efficiency
Confidence in the claim as commonly stated: Low.
Confidence in the narrower claim that a poorly controlled rewind costs measurable efficiency: High.
The belief circulates in several forms: a point per rewind, one to two points, cumulative losses with each rewind. The 2003 EASA and AEMT study characterizes the literature it was responding to as asserting drops of 1 to 5 percent, based largely on studies of motors up to 30 hp.
| Source | Year | What was actually tested | Finding | Rating |
|---|---|---|---|---|
| Colby and Flora, North Carolina Alternative Energy Corporation | 1990 | Four motors (two at 5 hp, two at 10 hp), 4-pole, 460 V, TEFC, rewound at a commercial shop and retested per IEEE 112 | The report summarizes the result as minor degradation. Its results tables show all four losing between 0.5 and 1.0 percentage points of full-load efficiency, with core loss falling after rewind in all four cases and stator winding resistance rising. Two had concentric windings replaced with lap windings | Medium: real measurements with published tables, sample of four small motors |
| Ontario Hydro and BC Hydro bulletins | 1991 to 1992 | Rewound motors, predominantly small | Cited in later literature as showing losses. We could not obtain the primary reports to verify scope or method | Low |
| EASA and AEMT, The Effect of Repair/Rewinding on Motor Efficiency | 2003 | 24 motors: 22 rated 50 to 300 hp plus two 7.5 hp machines. IEEE 112 Method B at the University of Nottingham, rewinds at Dowding and Mills. Round-robin verified across four labs | Controlled-process groups averaged 0.1 percentage point lower, inside the plus or minus 0.2 test accuracy. The uncontrolled group averaged 0.4 lower. The five motors rewound two or three times averaged 0.1 lower | High, with a disclosed trade interest |
| EASA and AEMT, The Effect of Repair/Rewinding on Premium Efficiency/IE3 Motors | 2019, executive summary published 2020 | Ten new premium efficiency and IE3 motors, 40 to 100 hp, tested at Advanced Energy (the only NVLAP-accredited independent motor efficiency lab at the time), rewound at an EASA-accredited service center | Change ranged from 0.3 higher to 0.5 lower in percentage points, averaging 0.1 lower, inside test accuracy. Efficiency rose in several cases | High, with the same disclosed trade interest |
Vendor and sponsor stake. EASA is the motor repair industry’s trade association, and both studies it co-sponsored concluded that good-practice repair maintains efficiency. That interest is real and should be stated. It is offset by the strength of the disclosure: independent third-party test labs, IEEE 112B methodology, full published test data down to individual motor loss segregation, and co-sponsorship of the 2003 work by the U.S. Department of Energy, British Nuclear Fuels, the UK Energy Efficient Best Practice Programme, the UK MoD Ships Support Agency, and UK Water Industry Research. In the 2019 study, motors were donated by seven manufacturers, Advanced Energy contributed funding toward testing, and the service center performed rewinds at reduced fees, all disclosed in the report.
What the evidence actually supports. The mechanism the old belief assumed, cumulative core damage from burnout, is the part that did not hold in the studies that looked for it. Colby and Flora’s own data runs against it: core loss went down after rewind in all four motors, while stator resistance went up because the shop changed the winding. The 2003 study reached the same conclusion from the other direction. Its uncontrolled Group A lost efficiency because a burnout temperature of 660°F (350°C) was too low to break down the old insulation, so removing the windings took excessive force, splayed the lamination teeth, and raised stray load losses. Two of those motors were also relubricated during assembly, adding 0.3 to 0.5 points of loss from bearing friction alone.
The honest reading is narrower than either camp’s slogan, and it should be stated as what the studies found rather than as a general law. In the motors tested, rewinding under controlled conditions produced efficiency changes inside the accuracy of the test method, including for motors rewound two and three times. In the one group rewound without those controls, the average loss was 0.4 percentage points. That is evidence that the variable is shop practice rather than rewinding as such, and shop practice is specifiable. It does not establish an upper bound on what any given poor repair can cost, and it does not extend to machine types the studies did not cover.
One precision note for anyone citing these numbers: efficiency changes here are percentage points, not percent. A move from 94.5 to 94.1 is 0.4 percentage points, and roughly a 7 percent increase in losses. Sources are inconsistent about this, and the distinction matters when the argument is about loss economics.
The condition thresholds inside a repair
Two measurements govern whether a good repair is available for a given machine. Both come from the January 2021 edition of the EASA and AEMT Good Practice Guide to Maintain Motor Efficiency, which is based on the 2019 and 2003 rewind studies and is the current edition to specify and download.
Core loss increase of 20 percent. The guide directs service centers to measure core loss before burnout and again after the winding is removed and the core cleaned, using the same tester at the same setting for both. Where losses increase by more than 20 percent, the first step is to confirm the tester settings have not changed and repeat the test. Where a repeat test confirms the increase, the escalation path is to repair the core, consider restacking or replacing the laminations, or consider replacing the motor.
The 2021 edition adds a scale for interpreting the size of a core loss change. Reproduced from CSA C392:20, it grades core loss change as follows:
| Increase in core loss | Impact level |
|---|---|
| Not measurable | None to slight |
| 20 percent | Threshold of measurement |
| 40 percent | Moderate |
| 60 percent | Consequential |
| 80 percent | Significant |
| 100 percent | Major |
| More than 100 percent | Excessive |
| More than 200 percent | Catastrophic |
The CSA table labels a 20 percent increase the “threshold of measurement.” Consistent with that classification, the guide directs the repairer to verify tester settings and repeat the test before deciding whether to repair or replace the core.
Burnout temperature. There is no single safe number, because the safe upper limit depends on the interlaminar insulation in the core, and the guide says so directly. Two failure modes bracket the question. Burning out significantly below 680°F (360°C) may leave the old winding insulation intact enough that coil removal takes excessive force, which can splay the lamination teeth and raise stray load losses. Burning out above 750°F (400°C) raises the risk of damaging the interlaminar insulation and increasing core loss, particularly where that insulation is organic or otherwise heat-sensitive. Some lamination insulation processes, including oxide steam-bluing and certain waterborne and organic varnishes, call for extreme caution and may be unsuitable for burnout at all. Every satisfactory result across both rewind studies came at 700°F (370°C) measured at the tooth area of the stator core. Where the interlaminar insulation type is unknown, the guide’s advice is to contact the motor manufacturer rather than assume a limit. Newer motors are more likely to carry C-5 inorganic lamination insulation, which tolerates higher temperatures than the coatings used on older machines.
Alongside those, the repair specification items that keep efficiency where it was: duplicate the original number of turns, winding design and coil configuration, and wire cross-sectional area; keep the mean length of turn at or below the original; replace bearings with the same size, type, and specification including seals and shielding; and avoid over-greasing on reassembly. Advanced Energy’s guidance is to replace bearings on every rewind.
Verifying the repair afterward
Full load testing is often impractical on a returned motor, so the 2021 guide gives three checks against the largest loss components, with numeric limits on two of them.
| Check | Limit | What it catches |
|---|---|---|
| Core loss, compared before burnout and after stripping and cleaning | An increase above 20 percent is a cause for concern | Damage to the interlaminar insulation and the core |
| Stator winding resistance, compared against the original where known | An increase above 3 percent is a cause for concern | Wrong wire size, wrong turn count, or a longer mean length of turn |
| Rotor losses | Should be unchanged unless the rotor was damaged in the failure or its diameter was machined | Rotor work that quietly changes the air gap |
The remaining components follow from specification rather than measurement: windage will not change unless the fan is changed, and friction will not change if identical bearings and seals with correct fits are used and the bearings are not over-greased. On a random lap winding, the guide also expects phase-to-phase resistance within 2 percent of the average, with wider variation normal on concentric windings. These are the numbers to write into a repair report requirement, because they turn “did we get a good repair” into something the service center reports rather than something you hope for.
The applicable American National Standard is ANSI/EASA AR100, Recommended Practice for the Repair of Rotating Electrical Apparatus. The current edition is AR100-2025, approved by the ANSI Board of Standards Review on November 20, 2025, succeeding AR100-2020. It is a recommended practice, so it sits alongside rather than above customer specifications, OEM requirements, and any requirements attached to specialized equipment. Naming the current edition in your repair purchase order is the practical mechanism for getting the practices above.
What changes on June 1, 2027
Federal efficiency levels step up on that date, and the change is now under a year out. The standards in force today at 10 CFR 431.25 (Table 5) apply to covered motors manufactured on or after June 1, 2016 but before June 1, 2027. Table 8 applies to covered motors manufactured on or after June 1, 2027. Both are keyed to date of manufacture.
Comparing the two tables, for covered NEMA Design A and B and IEC Design N motors:
| Rating | What happens on June 1, 2027 |
|---|---|
| Below 100 hp | Levels unchanged |
| 100 hp through 250 hp | Levels increase to Super Premium / IE4, which DOE describes as roughly a 20 percent reduction in losses relative to Premium / IE3 |
| Above 250 hp through 500 hp | Levels unchanged |
| Above 500 hp through 750 hp | Newly covered, entering at the levels applying at 500 hp |
Two scope changes come with it. The covered range extends from 500 hp to 750 hp. And air-over electric motors, which are exempt from the current Table 5 standards, become covered on June 1, 2027 under their own tables, with standard frame sizes covered from 1 through 250 hp and specialized frame sizes from 1 through 20 hp. Component sets, liquid-cooled motors, submersible motors, and inverter-only motors remain exempt.
The practical consequence for a repair-versus-replace policy: if you run motors in the 100 to 250 hp band, or air-over motors, the replacement side of your comparison changes in both efficiency and likely price after that date, and any breakpoint calculation built on today’s replacement prices and efficiencies will need rerunning.
One point to hold loosely. The 2027 standards apply to covered motors manufactured on or after June 1, 2027. The rule does not directly resolve the regulatory treatment of every repaired, rebuilt, or redistributed motor, so treat any compliance question about a specific machine as one for DOE or qualified counsel rather than something this or any reference page can settle.
MotorMaster+ is no longer the tool the reference documents assume. DOE’s motor sourcebook, tip sheets, tech brief, and the EASA guide all direct readers to MotorMaster+ for the repair-versus-replace calculation. It does not appear among DOE’s current Industrial Technologies Office software tools; the listed tool covering motors is now MEASUR, which includes a motors module. Anyone working from the older PDFs will be pointed at software DOE no longer lists. Build the calculation yourself from the formulas above, or use a current tool, and get a firm quote from your service center rather than relying on default cost tables.
Where the published guidance stops
Three gaps are worth naming, because a policy built on these documents will hit them.
The reliability question is not settled by measurement. EASA’s guide states plainly that no studies directly address whether a properly rewound motor is as reliable as a new one, and argues from materials and workmanship instead: insulation system upgrades to a higher temperature class, premium magnet wire, improved varnish methods. That is a reasonable argument. It is a different kind of evidence from the efficiency studies, and it should not be cited as though it were the same.
The efficiency studies do not cover every machine class. The 2003 and 2019 studies tested three-phase induction motors, predominantly low-voltage, with one medium-voltage machine in 2003. The Good Practice Guide explicitly excludes hazardous area and explosion-proof motors from its winding-change guidance. Do not extend the findings to those, to DC machines, or to permanent magnet motors without separate evidence.
The load data behind the standard advice is old. The frequently repeated finding that more than 40 percent of industrial motors operate at or below 40 percent of their load rating comes from DOE’s United States Industrial Electric Motor Systems Market Opportunities Assessment, published in 1998. It is directionally useful for arguing that failures are an opportunity to right-size. It is not current measurement of your plant, and the fix for that is measuring your own load-duty cycles.
Terminology used throughout this page, including mean length of turn and stray load loss, is defined in our maintenance and reliability glossary.
Frequently asked questions
At what horsepower should a failed motor be replaced instead of repaired?
There is no single horsepower that applies across facilities. Advanced Energy’s Horsepower Bulletin treats the breakpoint as a calculated output of your electric rate, annual operating hours, payback requirement, supplier discount, and average motor load. Its own worked example produces a TEFC breakpoint of 10 hp at $0.04 per kWh and 60 hp at $0.12 per kWh for otherwise identical facilities. DOE’s motor sourcebook offers the narrower guidance that for general purpose motors of 15 hp and below, buying a new premium efficiency replacement may cost less than repairing.
What percentage of a new motor’s cost makes repair uneconomical?
Advanced Energy’s published decision tree uses 60 percent: where a repair will cost more than 60 percent of a new NEMA Premium motor, the recommendation is to replace. Motor service centers commonly publish wider guidance in the 50 to 80 percent range, which is commercial advice rather than documented analysis. Any single percentage works better as a screening device than as a decision, because it ignores run hours, efficiency difference, and downtime cost.
Does rewinding a motor reduce its efficiency?
In the motors that have been tested, rewinding under controlled processes produced efficiency changes too small to distinguish from test error. The 2003 EASA and AEMT study of 24 motors found controlled-process groups averaged a 0.1 percentage point change, inside the plus or minus 0.2 accuracy of the IEEE 112B test method, and the 2019 follow-up on ten premium efficiency and IE3 motors found the same. Rewinding without process control did cost efficiency: the uncontrolled group in the 2003 study averaged 0.4 percentage points, traced to a burnout temperature too low to release the windings cleanly, which damaged the lamination teeth.
Do repeated rewinds compound efficiency losses?
The 2003 study tested this directly. Five low-voltage motors of 100 to 200 hp were rewound two or three times using controlled processes and averaged a 0.1 percentage point change overall. Two 7.5 hp motors put through three burnout cycles averaged a 0.5 percentage point improvement. Within that sample and under those controls, repeated rewinds did not degrade efficiency or core loss.
What should a motor repair specification require to protect efficiency?
Duplicate the original number of turns, winding design and coil configuration, and wire cross-sectional area; keep the mean length of turn at or below the original; replace bearings with the same size, type, and specification including seals and shielding; control burnout oven temperature with the limit set by the core’s interlaminar insulation and monitored at the stator core; measure and record core loss before burnout and after core cleaning; and avoid sandblasting the core, grinding laminations, filing slots, increasing the air gap, or over-greasing bearings. Require the repair report to show the before and after core loss comparison and the final winding resistance, and treat a core loss increase above 20 percent or a stator resistance increase above 3 percent as a cause for concern. Name ANSI/EASA AR100-2025 in the purchase order.
When does downtime override the cost comparison?
Advanced Energy’s guidance is that where the cost of downtime per hour exceeds twice the purchase price of a new motor, the motor should be replaced with a new one installed at the earliest scheduled outage, replaced on a two to five year cycle, and backed by a dedicated spare in inventory. EASA and DOE’s joint guide identifies production downtime as the factor that usually decides the question, which is why both documents recommend setting policy before a failure rather than during one.
Sources
- Electrical Apparatus Service Association and Association of Electrical and Mechanical Trades, The Effect of Repair/Rewinding on Motor Efficiency: EASA/AEMT Rewind Study and Good Practice Guide to Maintain Motor Efficiency, 2003.
- Electrical Apparatus Service Association and Association of Electrical and Mechanical Trades, Good Practice Guide to Maintain Motor Efficiency, January 2021 edition (Version 1021), based on the 2019 and 2003 rewind studies. Source for the burnout temperature guidance, the core loss and stator resistance thresholds, and the post-repair verification checks.
- CSA C392:20, Table A.1, as reproduced in the 2021 Good Practice Guide to Maintain Motor Efficiency for levels of change in core losses.
- Electrical Apparatus Service Association and Association of Electrical and Mechanical Trades, The Effect of Repair/Rewinding on Premium Efficiency/IE3 Motors, Executive Summary, 2020 (study conducted 2019).
- Electrical Apparatus Service Association in cooperation with the U.S. Department of Energy Motor Challenge Program, A Guide to AC Motor Repair and Replacement, 1999.
- U.S. Department of Energy, Advanced Manufacturing Office, Improving Motor and Drive System Performance: A Sourcebook for Industry.
- U.S. Department of Energy, Office of Industrial Technologies, Motor Repair Tech Brief, DOE/GO-10099-938, March 2000.
- Advanced Energy Corporation, Horsepower Bulletin, 2015.
- Roy S. Colby and Denise L. Flora, Measured Efficiency of High Efficiency and Standard Induction Motors, North Carolina Alternative Energy Corporation compilation of the paper presented at the IEEE Industry Applications Conference, October 1990.
- Energy Conservation Program: Energy Conservation Standards for Electric Motors, direct final rule, 88 FR 36066, June 1, 2023; confirmation of effective and compliance dates, 88 FR 72347, October 20, 2023.
- 10 CFR 431.25, Energy conservation standards and effective dates, Tables 5 and 8 through 10.
- U.S. Department of Energy, Industrial Technologies Office software tools.
- ANSI/EASA AR100-2025, Recommended Practice for the Repair of Rotating Electrical Apparatus.
- NEMA MG 1, Motors and Generators, Tables 12-11 and 12-12.
- IEEE Std. 112, Standard Test Procedure for Polyphase Induction Motors and Generators, Method B.
- U.S. Department of Energy, United States Industrial Electric Motor Systems Market Opportunities Assessment, 1998.