
Everyone tracks what downtime costs. Far fewer track how often it happens. And when you go looking for a frequency benchmark, “how many unplanned stops should a typical plant expect in a month,” you mostly find vendor blogs quoting each other.
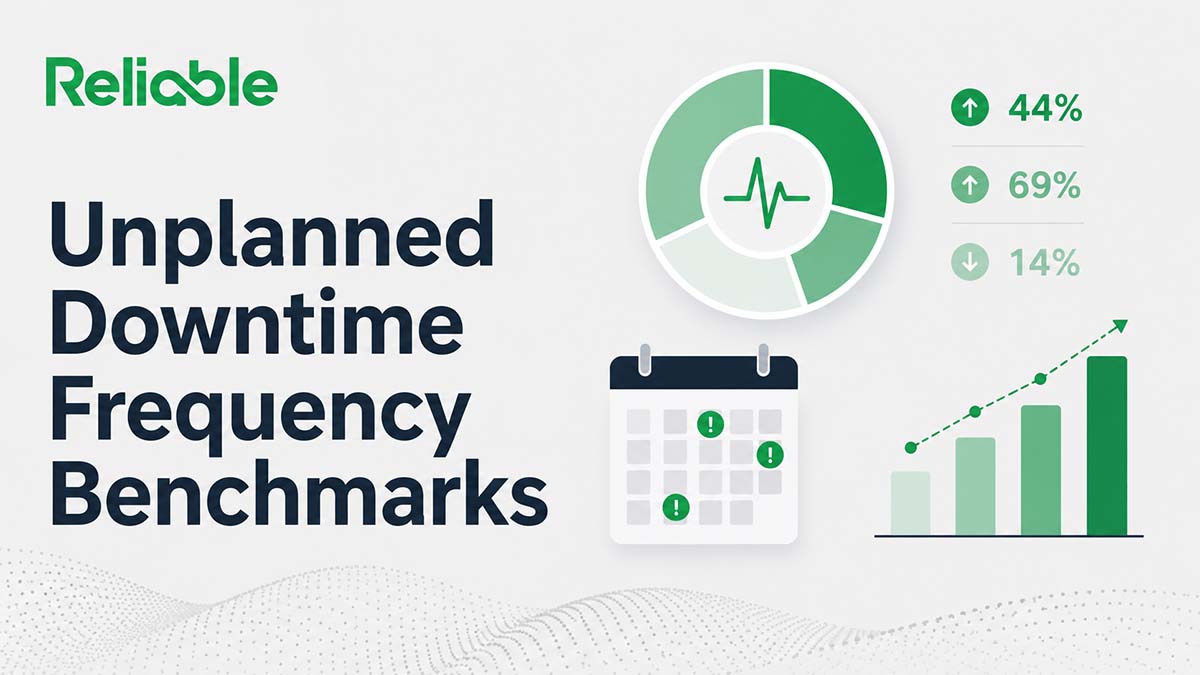
Start with the best-sourced data, which comes from ABB. Its 2023 Value of Reliability survey polled 3,215 maintenance decision-makers across 11 industrial sectors. In response to a question about unplanned outages on critical equipment, 69% reported experiencing one at least monthly. A second ABB survey in 2025, of 3,600 senior decision-makers, asked about equipment-related interruptions and found 44% hit one at least monthly, with 14% weekly. The two surveys used different questions and samples, so they aren’t directly comparable and the difference shouldn’t be read as a trend. What both establish is that monthly interruptions are widespread across industry, with no single universal number that defines “normal.” And widespread is a long way from acceptable.
Past those prevalence figures, the data thins out fast. The widely shared “incidents per month” and “hours per month” counts trace back to a single survey of 181 professionals. A per-industry frequency table isn’t published by any standards body we could find. So this page does two things: it rates the frequency numbers that hold up under scrutiny, and it shows why the maturity story runs on availability percentages rather than raw stop counts.
This is the companion to our cost guide. For the dollar side, see the real cost of unplanned downtime in manufacturing. Here we’re on frequency: how often the line goes down, what’s typical, and where the usable data runs out.
What “Frequency” Really Measures
Frequency sounds simple until you try to benchmark it. There are at least three different things people mean by “how often”:
- Share of plants affected. What percentage of facilities hit at least one unplanned stop in a given window (usually a month). ABB’s 69% is this kind of figure.
- Events per plant. How many discrete unplanned stops a single plant logs per month or per year. This depends entirely on how you define an “event.” A two-minute jam and a four-hour breakdown both count as one stop.
- Availability, a time-based companion measure. What fraction of scheduled time the asset was up. A plant at 95% availability lost 5% of its scheduled hours, though that figure usually blends planned and unplanned losses.
These three answer different questions, and they don’t convert into each other cleanly. A plant can post a high event count (lots of short jams) and still hold excellent availability, or suffer rare-but-catastrophic stops that wreck availability with a low event count. When someone quotes a frequency benchmark, the first question is always: frequency of what?
The Reliable Confidence Score
We rated each widely cited frequency figure on how well it traces to a primary source and how broadly it applies. High means verified and broadly applicable. Medium means real but scoped or hedged. Low means it circulates widely and doesn’t hold up.
| Source or Claim | Figure | Reliable Confidence | What It Really Means |
|---|---|---|---|
| ABB, Value of Reliability survey (2023) | 69% reported an unplanned outage on critical equipment at least monthly | HighVerified; multi-sector survey, n=3,215, 11 sectors | The best-sourced prevalence figure. Monthly critical-equipment outages are widespread, which is not the same as acceptable. |
| ABB, Modernization for Resilience survey (2025) | 44% reported equipment-related interruptions at least monthly; 14% weekly | HighVerified; n=3,600 senior decision-makers | A second large ABB survey. Different question, sample, and year from the 2023 figure, so the two aren't directly comparable and the gap isn't a trend. |
| Siemens / Senseye, True Cost of Downtime (pub. 2024) | ~25 unplanned incidents per month (down from 42 in 2019) | MediumSmall sample: 181 online interviews at large industrial organizations, 4 sectors | Lower than the 2019 figure, but Siemens says its year-on-year results are indicative only. Not a number your plant should match. |
| Siemens / Senseye, True Cost of Downtime (pub. 2024) | ~27 hours of unplanned downtime per month (down from 39 in 2019) | MediumSame small-sample caveat; Siemens calls the year-on-year comparison indicative only | Works out to about 6 hours a week at the large organizations surveyed. |
| Circulated vendor figure | "~800 hours/year, ~15 hours/week" of unplanned downtime | LowMethodology and definitions could not be verified | The Siemens report itself puts the annual figure at 326 hours. The 800-hour version couldn't be traced to a verifiable source. |
| Nakajima / JIPM, Introduction to TPM (1988) | 90% availability (the availability component of the 85% world-class OEE) | HighFoundational benchmark, but framed for discrete manufacturing | The availability component of a discrete-manufacturing OEE benchmark. It's defined differently from the process industry's mechanical availability, so the two numbers aren't directly comparable. |
| Solomon Associates, RAM Study | Mechanical availability "well above 96%" (Solomon's stated threshold) | MediumSolomon's public guidance; exact quartile cutoffs are proprietary | Solomon says a plant not well above 96% mechanical availability likely has untapped margin. This is a maintenance-centric metric, not the same as OEE availability. |
| Standards bodies (SMRP, ISO 14224, EN 15341) | An openly available per-industry unplanned-stop frequency table | MediumNegative finding; none identified in open sources | These standards define data taxonomy (ISO 14224) and maintenance KPIs (EN 15341); they aren't benchmark tables. The frequency figures reviewed for this article came primarily from vendor surveys. |
The Big Takeaway
The honest takeaway is that there’s no single “normal.” ABB’s two large surveys put monthly interruptions at 69% (2023, unplanned outages on critical equipment) and 44% (2025, equipment-related interruptions). They used different questions and samples, so the two aren’t directly comparable, and the gap shouldn’t be read as a real-world drop. What both agree on is that monthly interruptions are widespread across industry. Widespread is a long way from acceptable, though, and that gap is exactly where reliability work lives. A plant that treats a monthly outage as just the cost of doing business is leaving availability, and margin, on the table.
Two big ABB surveys, two prevalence rates (44% and 69%), measured different ways. Monthly interruptions are widespread across industry, but no single number defines normal.
So use these benchmarks to locate yourself, then push. Frequency is a starting line, not a finish line.
Why the Numbers Vary So Much
Three things make frequency benchmarks slippery.
Definitions and question wording. One plant logs every micro-stop over 60 seconds; another only logs events that need a work order. Same reality, wildly different “incidents per month.” Survey questions vary the same way: ABB’s 2023 survey reported 69% monthly and its 2025 survey 44%, but they used different questions, samples, and years, so the two aren’t directly comparable. Until you know the counting rule and the exact question, a frequency number is hard to interpret.
Geography and sector mix. The headline figures are global averages, and ABB’s own breakdowns show the share moving around by country and region. A benchmark pulled from a different geographic or sector blend will land somewhere else, so treat any headline figure as a midpoint rather than a fixed rate.
Sample scope. The Siemens incident and hours figures (about 25 incidents and 27 hours per month) come from 181 completed online interviews with maintenance, engineering, and IT professionals at large industrial organizations across four sectors (automotive, FMCG, heavy industry, and oil and gas), worldwide, covering April 2019 to March 2023. That’s a small base, and the report scopes its conclusions to large organizations.
Siemens also states plainly that its year-on-year results are not directly comparable and should be seen as indicative only, because the sector mix in the sample shifts from year to year. So the “25 from 42” and “27 from 39” comparisons show lower numbers than 2019, but Siemens itself frames them as indicative rather than precise, and they shouldn’t be read as a universal plant benchmark. (The separate predictive-maintenance benefit figures in the same report draw on Senseye software deployments, not on this survey.)
The “800 hours a year” claim is worth a separate flag. It circulates in maintenance-software blogs, where it sits alongside Siemens-attributed figures as roughly 800 hours a year, or about 15 hours a week. But the Siemens report itself states that an average large plant loses 326 hours a year. We couldn’t trace the 800-hour version to a source that explains its methodology or its definition of “downtime,” so treat it with caution until someone produces that underlying detail.
How to Use These Benchmarks Safely
External frequency numbers are good for one thing: sanity-checking your own. They make poor targets.
Start by measuring your own frequency three ways: share of months with at least one unplanned stop, count of stops per month, and availability. Then compare the shape of your data to the benchmarks, not the absolute values. If you’re logging 200 “events” a month, that may indicate micro-stops or simply a broader asset population, and the ABB or Siemens figures won’t map to yours.
For the maturity dimension, availability tells you more than a raw incident count, but the main availability metrics aren’t interchangeable. The famous 90% from Nakajima is the availability component of the 85% world-class OEE score, developed for discrete manufacturing, and it’s calculated against planned production time.
Continuous-process plants (refining, chemicals) tend to track mechanical availability instead, a maintenance-centric measure with a different denominator. Solomon’s RAM Study, which has benchmarked more than 1,500 plants and 8,500 process units, says a plant not well above 96% mechanical availability likely has untapped margin.
Power generation uses yet another family of measures (equivalent availability factor, equivalent forced outage rate, and the related NERC GADS framework). Use the metric your industry uses, hold yourself to its benchmark, and avoid comparing a 90% OEE-availability figure against a 96% mechanical-availability figure as though they shared a scale, because they don’t.
And tie frequency to cost. A plant with frequent short stops and a plant with rare long ones can post identical downtime hours and radically different bills. Pair this page with the cost guide so you’re optimizing the metric that moves money.
Where Teams Go Wrong
Chasing a single “right” number. There’s no official “X unplanned stops per month is good.” Anyone quoting one without a definition and a source is guessing.
Comparing incident counts across plants with different logging rules. This is the most common error. Your 12 a month and their 40 a month might describe identical reliability with different counters.
Treating availability as pure unplanned downtime. OEE availability and mechanical availability both fold in planned losses depending on how they’re calculated. A 90% availability figure does not mean “10% unplanned downtime.” Read the definition before you benchmark against it.
Treating two different availability metrics as one scale. OEE availability and mechanical availability use different definitions and denominators. Benchmarking your OEE availability against a mechanical-availability target (or the reverse) compares numbers that were never on the same footing.
Confusing frequency with severity. Cutting incident count feels like progress, but if the stops you eliminated were the two-minute jams while the four-hour breakdowns remain, you’ve improved the wrong number.
Methodology
The Reliable Confidence Score rates our confidence in the claim, not always in a single number. A figure earns High when it traces to a primary source and applies broadly. It earns Medium when the source is real but scoped (a small survey, a proprietary study) or when open sources disagree. It earns Low when the figure circulates widely but can’t be traced to a verifiable origin.
We treated frequency as three distinct measures (share of plants affected, events per plant, and availability) and did not convert between them, because the conversion depends on local definitions we can’t verify.
The ABB figures are drawn from ABB’s published survey summaries: the 2023 Value of Reliability survey (Sapio Research, July 2023; 3,215 respondents across 11 industrial sectors; 69% monthly, in response to a question about unplanned outages on critical equipment) and the 2025 Modernization for Resilience survey (Sapio Research; 3,600 senior decision-makers; 44% monthly and 14% weekly equipment-related interruptions).
The two ask different questions, so they’re presented side by side rather than as a trend. The Siemens incidents and hours figures are from the True Cost of Downtime report published in 2024, based on 181 completed online interviews with maintenance, engineering, and IT professionals at large industrial organizations across automotive, FMCG, heavy industry, and oil and gas, covering April 2019 to March 2023; we rate them Medium because the sample is small and because Siemens states its year-on-year results are indicative only. (The report’s predictive-maintenance benefit figures draw on Senseye software deployments and are not used here.)
The 90% figure is the availability component of the 85% world-class OEE construct from Nakajima’s Introduction to TPM (1988), developed primarily for discrete manufacturing; it’s High as a benchmark definition, though it isn’t directly comparable to process-industry mechanical availability. The Solomon figure (“well above 96%” mechanical availability) is taken from Solomon’s own RAM Study materials and rated Medium because the precise quartile thresholds are proprietary.
The negative finding reflects that we did not identify an openly available standards-body table providing plant-level unplanned-stop counts by industry: ISO 14224 standardizes reliability and maintenance data collection, EN 15341 defines maintenance KPIs, and SMRP catalogs metrics, but none publishes a per-industry frequency benchmark.
The Short Version
There’s no single frequency benchmark to memorize, and that’s the finding. ABB’s two large surveys put monthly interruptions at 69% (2023, unplanned outages on critical equipment) and 44% (2025, equipment-related interruptions); they used different questions and samples, so the two aren’t directly comparable and the gap isn’t a trend. Both agree monthly interruptions are widespread, which doesn’t make them acceptable. Everything past those prevalence figures needs a caveat.
The incident and hour counts come from a small survey (181 interviews) that Siemens says isn’t directly comparable year to year. No standards body publishes an openly available per-industry frequency table. And for the maturity question, availability tells the story better than counting stops, as long as you use the right metric for your industry: OEE availability (the discrete world-class component is 90%) and mechanical availability (Solomon flags anything not well above 96%) are different measures and don’t sit on the same scale. Measure your own frequency three ways, compare shapes rather than absolutes, and tie it back to cost.
Sources
- ABB, “Value of Reliability” survey (Sapio Research, July 2023; n=3,215; 11 sectors; 69% report monthly unplanned outages on critical equipment). https://new.abb.com/news/detail/107660/abb-survey-reveals-unplanned-downtime-costs-125000-per-hour
- ABB, “Modernization for Resilience” survey (Sapio Research, 2025; n=3,600 senior decision-makers; 44% monthly, 14% weekly equipment-related interruptions). https://new.abb.com/news/detail/129763/industrial-downtime-costs-up-to-500000-per-hour-and-can-happen-every-week
- Siemens / Senseye Predictive Maintenance, “The True Cost of Downtime 2024” (181 completed online interviews; automotive, FMCG, heavy industry, oil and gas; April 2019 to March 2023). https://assets.new.siemens.com/siemens/assets/api/uuid:1b43afb5-2d07-47f7-9eb7-893fe7d0bc59/TCOD-2024_original.pdf
- Seiichi Nakajima, Introduction to TPM: Total Productive Maintenance, JIPM / Productivity Press, 1988 (world-class OEE 85%; availability component 90%).
- Solomon Associates, Reliability & Maintenance (RAM) Study, “Why Participate” (mechanical availability well above 96%; 1,500+ plants, 8,500+ process units). https://ramstudy.solomoninsight.com/
- ISO 14224:2016, Petroleum, petrochemical and natural gas industries: Collection and exchange of reliability and maintenance data for equipment. https://www.iso.org/standard/64076.html
- EN 15341:2019+A1:2022, Maintenance: Maintenance Key Performance Indicators (CEN standard; defines maintenance KPIs rather than frequency benchmarks).