What Motor Current and Vibration Reveal About Machine Condition
A motor current spectrum and a vibration spectrum may point to the same machine problem while displaying very different amplitudes. That difference matters when we decide where to inspect, what to repair, and whether a correction worked. It also raises a useful question: can a current signature tell us how much a machine is vibrating?
The answer requires separating diagnosis from amplitude prediction. Motor Current Signature Analysis (MCSA) can identify electrical and mechanical conditions through their interaction with the motor’s magnetic field. Predicting housing velocity in millimeters per second requires an additional relationship between that electrical response and motion at a particular location.
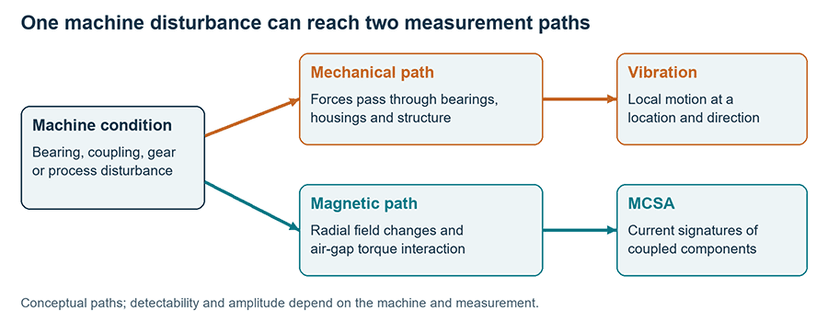
Follow the Disturbance Through the Machine
An accelerometer measures motion where it is mounted and in the direction it senses. A bearing disturbance reaches that sensor through mechanical components. Mounting stiffness, structural resonance, distance and direction influence the result. A low reading at one point does not describe every bearing or every direction.
The two methods observe different consequences of a disturbance.
MCSA observes the current response to radial magnetic-field changes and air-gap torque interactions. Conditions in bearings, couplings, gears and driven equipment can therefore appear in the motor current. Torque-related signatures do not require readily measurable shaft-speed ripple. Electrical Signature Analysis (ESA) adds voltage measurements and supports further evaluation of power quality, power and air-gap torque.
Consider a pump bearing and a sensor mounted on the motor housing. The mechanical signal must cross the intervening structure, while a torque-related disturbance can interact with the motor through the shaft train. Those paths have different sensitivities. Moving a vibration sensor closer to the bearing may improve local evidence without changing the current measurement.
Understand What the Decibels (dB) Represent
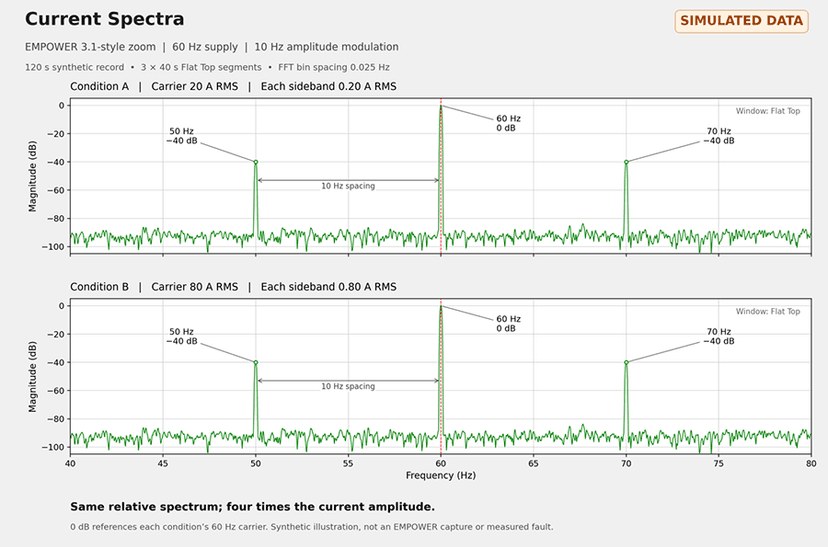
Relative current dB expresses the size of a selected component compared with a defined reference current component. It does not supply an absolute mechanical quantity. The arithmetic is straightforward:
Relative current dB = 20 log₁₀(component current / reference current)
For example, 0.20 A compared with 20 A is −40 dB. So is 0.80 A compared with 80 A. Figure 2 illustrates both conditions: the sideband current is four times larger in Condition B, although the displayed ratio is unchanged. Both currents use RMS amplitudes.
Neither result says how far the housing moves. A conversion must account for the machine’s magnetic response and the mechanical path to the vibration sensor. Changing the bearing support or measurement direction can change that relationship.
Frequency also changes the meaning of vibration amplitude. For a single sinusoidal component, equal velocity at ten times the frequency means ten times the acceleration and one-tenth the displacement. Across a broad band, each frequency must be treated separately. One overall acceleration number cannot be converted using an arbitrarily selected running speed.
Match the Frequency Relationship
Related signatures also need not occupy the same raw frequency bin. In a simple amplitude-modulation example, a 10 Hz disturbance around a 60 Hz electrical carrier produces sidebands at 50 and 70 Hz. The relevant mechanical frequency is the 10 Hz spacing. This illustrative pattern alone does not identify a fault.
More samples per second at the same duration do not, by themselves, improve bin spacing.
Closely spaced peaks require adequate record length and suitable processing. A continuous 120-second FFT record has nominal bin spacing of about 0.0083 Hz; processing shorter segments changes that value. Window choice and changing speed affect separation too. More samples per second at the same duration do not, by themselves, improve bin spacing.
What the Field Comparison Shows
The project compared current data with 116 motor-side vibration recordings from 20 matched motors. Repeated readings were not treated as additional independent machines. One promising result involved six motors in the same equipment family, a 1–2 kHz current band, and drive-end vertical vibration velocity in that band.
The current-band ratio and vibration had a log-amplitude correlation of approximately 0.85. Across 19 motors from different families, the corresponding correlation was approximately −0.11. Grouping unlike machines did not produce a useful common relationship.
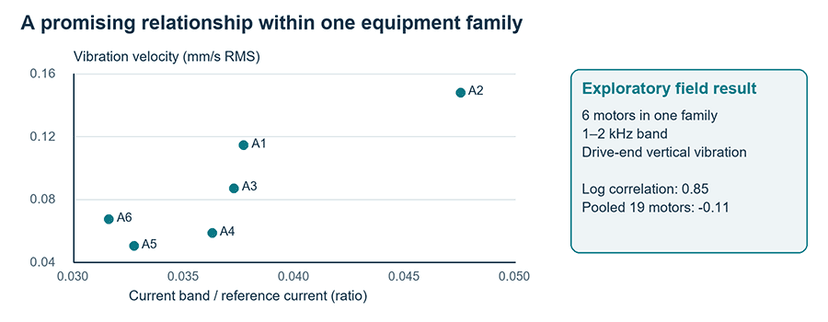
Figure 3. Anonymized project measurements. Each point represents one motor. The association within Family A did not transfer to the pooled equipment comparison.
A proportional formula fitted to five family members and tested on the omitted sixth produced a worst prediction error factor of about 1.55. That means the larger of prediction and measurement was 1.55 times the smaller. It is not a certified accuracy specification.
The family, frequency band and sensor direction were selected after exploring many alternatives. Some current and vibration records came from different days, and the observed current ratios occupied a narrow range. These results justify testing the relationship on new machines; they do not establish a universal conversion or a confirmed bearing diagnosis.
For quantitative validation, fix the feature and processing first, then acquire paired measurements with operating conditions documented. That research requirement is separate from routine MCSA diagnosis. A shared frequency band alone does not prove a shared physical excitation.
Apply the Findings to Maintenance Decisions
For the practical method addressed in this project, begin with one current clamp on one phase and one two-minute acquisition. Use calculated component frequencies and modulation relationships to assess the coupled motor and driven equipment. Collection time excludes access, setup and interpretation; it is not a universal specification for every instrument.
Then select the follow-up measurement that answers the remaining question. Use targeted vibration for local bearing response, direction, resonance, balancing or mechanical localization. Add voltage and current ESA when the question involves supply conditions or measured electrical power. Component information and suitable processing remain necessary when load, speed or electrical frequency changes.
Then select the follow-up measurement that answers the remaining question.
A disagreement between methods is useful evidence. A strong local vibration response may involve structural amplification. A current signature with modest housing motion may involve a different radial or torsional interaction. Trace the mechanism before accepting or dismissing either result.
Document what was measured: the electrical reference, current component or band, vibration units, sensor location and direction, and relevant speed. These details make a comparison usable. They also prevent a later reviewer from treating a band-integrated current ratio as a single sideband or comparing peak vibration with an RMS value. Preserve the original records when investigating a disputed result.
Connect Condition Findings to Verified Improvement
The same discipline applies to energy claims. A spectral amplitude is not automatically a watt loss, and a reduction in vibration does not establish an equal percentage reduction in electricity consumption. The project’s archived loss estimates remain exploratory; verified savings require power measurements and a fair comparison of operating duty.
Use the diagnosis to specify a correction, then confirm the result. Following alignment, lubrication, structural work or a process adjustment, check the relevant signatures and operating performance. The maintenance value comes from identifying a correctable condition and demonstrating that the intervention improved the machine.
Bibliography
Penrose, H., ‘Relating Motor Current Signatures to Mechanical Vibration Study,’ Relating Motor Current Signatures to Mechanical Vibration - ReliaSquatch, Sept, 2026