The Real Cost of Poor Quality: Scrap, Rework, and Returns (2026 data)
Every plant makes scrap. Most plants can tell you the weight in the bin. Almost none can tell you what it costs. Quality-related costs run between 15% and 20% of sales revenue at many manufacturers, and as high as 40% of total operations at the worst performers, according to the American Society for Quality. Even a thriving company, by ASQ's rule of thumb, spends 10% to 15% of operations on the cost of poor quality.
Those percentages are not abstractions. They are the material you paid for and then threw away, the labor you paid twice, the machine hours consumed making the same part a second time, the warranty checks, the returns, the recalls, and the customers who quietly moved their volume elsewhere.
In 2025 alone, U.S.-based manufacturers paid $30.37 billion in product warranty claims (Warranty Week), U.S. retailers took back an estimated $849.9 billion in merchandise (NRF and Happy Returns), and 997 vehicle safety recalls affected more than 29 million vehicles (NHTSA).
This guide breaks down the cost of poor quality (COPQ) into its parts, shows you what the most quoted figures actually rest on, gives you a formula to calculate your own number, and explains why maintenance and reliability own a larger share of it than most quality departments admit. We will also cover what most COPQ articles skip: the difference between a benchmark you can cite and one you should not.
How Much Does Poor Quality Actually Cost?
The short answer: far more than the scrap report shows. Quality cost accounting was first described by Armand Feigenbaum in a 1956 Harvard Business Review article, and his later estimate remains the most cited: a hidden plant inside every plant, consuming 15% to 40% of capacity to rework, repair, and replace defective work. That capacity does not appear on the production schedule. It appears as overtime, missed ship dates, and machines that are always busy but never seem to produce enough.
Quality-related costs run 15% to 20% of sales revenue at many companies, and as high as 40% of total operations at some. (ASQ, Cost of Quality)
ASQ's own 2025 benchmarking report found that only 31% of respondents feel they fully understand the impact of quality costs on their organization's financial performance (ASQE 2025 Insights on Excellence Cost of Quality Report). That tracks with older ASQ research: in a study of 393 quality managers, fewer than 35% reported systematically tracking cost of quality at all (Sower and Quarles, 2003). The number is large, and most companies have never calculated it.
The reason is structural. Scrap shows up in a materials variance. Rework labor gets absorbed into direct labor hours. Re-inspection is just inspection. Warranty sits in a reserve account managed by finance. Returns are handled by logistics. Expedited replacement freight goes to shipping. No single cost center owns poor quality, so no single report shows it.
The Four Buckets: Prevention, Appraisal, Internal Failure, External Failure
Cost of quality (COQ) is the total of everything you spend to prevent defects, find defects, and pay for the defects you did not prevent or find. The standard model splits it into four categories. The first two are the cost of good quality. The last two are the cost of poor quality.
| Category | What it pays for | Typical line items | Good or poor quality? |
|---|---|---|---|
| Prevention | Stopping defects before they occur | Training, process design, supplier qualification, equipment maintenance, mistake-proofing | Cost of good quality |
| Appraisal | Finding defects before shipment | Inspection, testing, calibration, audits, incoming material checks | Cost of good quality |
| Internal failure | Defects caught before the customer | Scrap, rework, re-inspection, sorting, downgrades, quality-caused downtime, failure analysis | Cost of poor quality |
| External failure | Defects that reach the customer | Warranty claims, returns, recalls, complaint handling, chargebacks, expedited replacements, lost sales | Cost of poor quality |
Table 1: The four cost of quality categories (PAF model). Source: ASQ, Cost of Quality; Feigenbaum, 1956.
The relationship between the buckets is the whole point of the model. Dollars spent in prevention and appraisal are supposed to reduce dollars lost in internal and external failure by a larger amount. When a plant cuts the inspection budget to hit a cost target and warranty claims rise two quarters later, it has not saved money. It has moved money from a visible line to a hidden one, and paid a premium for the transfer.
Internal Failure: Scrap and Rework
Internal failure is the cost of defects caught before the customer sees them. It is the most visible part of COPQ and still routinely undercounted, because plants price scrap at material cost and treat rework as free.
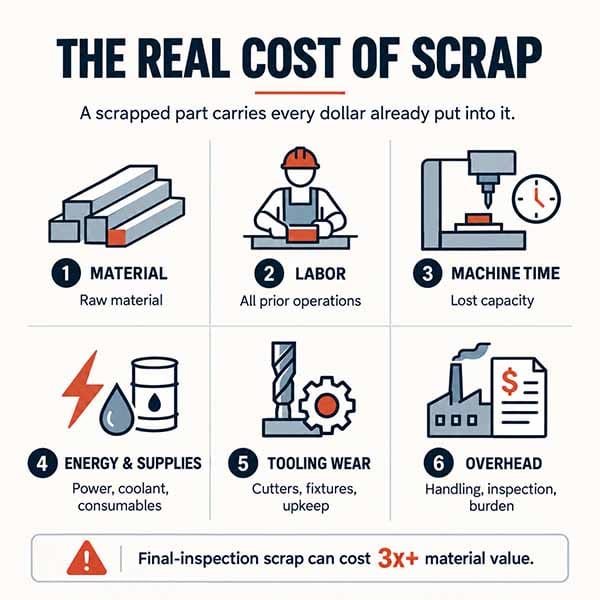
Scrap is not just the raw material. A part scrapped at final inspection carries every dollar invested in it up to that point: material, direct labor at every operation, machine time, energy, consumables, tooling wear, and the overhead allocated to all of it. A casting scrapped after machining costs several times what the same casting cost when it arrived at receiving. Pricing scrap at material cost alone can understate the loss by a factor of three or more on multi-operation parts.
Rework is worse, because it usually never gets counted. A reworked part re-enters the good count. The labor to fix it is absorbed into the shift's direct hours. The machine time it consumed shows up as lower performance in your OEE calculation, not as a quality loss. Feigenbaum's hidden plant is mostly rework.
Scrap priced at material cost alone can understate the real loss by a factor of three or more on multi-operation parts. Rework usually is not counted at all.
First pass yield (FPY) is the metric that exposes rework, because it counts a unit as good only if it passed the first time without repair. Published FPY and scrap-rate benchmarks vary enormously by source, from 85% to 98% FPY depending on which software vendor's blog you read, and almost none of them cite a dataset. One exception: the Fabricators & Manufacturers Association's operational benchmarking survey, as reported in 2026 benchmark compilations, puts scrap and rework at roughly 1.4% of sales for the average U.S. metal fabricator and under 1.0% for the top quartile. Treat any other benchmark as a vendor's claim until you find its source. Your own trend line, measured consistently, is the benchmark that matters.
External Failure: Warranty, Returns, and Recalls
External failure is the cost of defects the customer found for you. It is smaller in count than internal failure and far larger per unit, because every escaped defect carries freight, handling, investigation, replacement, and relationship damage on top of the original loss. Three national datasets put a floor under it.
Warranty claims: $30.37 billion in 2025
Warranty Week has compiled warranty data from the financial statements of more than 1,400 U.S.-based manufacturers since the FASB first required its disclosure in 2003. In 2025, those manufacturers paid $30.37 billion in claims, an increase of 4% from 2024, set aside $33 billion in accruals, and held $72 billion in warranty reserves. The average claims rate was 1.30% of product sales, against a 23-year average of 1.42%. The rate varies widely by sector.
| Sector | 2025 claims rate | Long-run average (2003 to 2025) | Notes |
|---|---|---|---|
| All U.S.-based manufacturers | 1.30% | 1.42% | $30.37 billion paid in 2025, up 4% from 2024 |
| Automakers (Ford, GM, Tesla) | 1.8% to 3.5% | Not published as a group | Second quarter 2025 rates; Ford highest at 3.5% |
| Consumer electronics | 1.38% | 1.50% | Excludes Apple, which no longer reports |
| Major appliances | 1.27% | 1.92% | Quarterly range 1.17% to 1.33% |
| Computer OEMs | 1.11% | 2.24% | $2.02 billion in claims, down 5% |
| HVAC | 0.93% | 0.90% | Fourth quarter spike to 1.27% |
| Homebuilders | 0.69% | Higher and more volatile | Claims rates spiked during the 2008 recession |
| Building materials | 0.58% | 0.67% | Most stable sector tracked |
| Semiconductors and PCBs | 0.42% | 0.70% | Lowest rate, but rising sharply from 2024 |
Table 2: Warranty claims paid as a percentage of product sales, U.S.-based manufacturers, 2025. Source: Warranty Week, 23rd Annual Product Warranty Report and 2025-2026 sector reports.
Automakers stand out. In the second quarter of 2025, Ford's warranty claims rate was 3.5% of vehicle sales, GM's was 3.1%, and Tesla's was 1.8% (Warranty Week, Mid-Year U.S. Auto Warranty Expenses). Ford's accrual rate hit a record 4.5% in the first quarter. At those rates, warranty alone consumes more of revenue than many automakers earn in operating margin on the vehicles that generated the claims.
Returns: $849.9 billion in 2025
The National Retail Federation and Happy Returns estimate that U.S. retailers took back 15.8% of annual sales in 2025, or $849.9 billion in merchandise, down slightly from 16.9% and $890 billion in 2024. Online purchases returned at an estimated 19.3%. Not every return is a defect; fit, preference, and bracketing (ordering several sizes to keep one) drive a large share. But for manufacturers, every return for cause is an external failure cost that includes reverse freight, inspection, restocking or disposal, and the credit issued to the retailer.
Recalls: 997 campaigns, 29 million vehicles
NHTSA reports that 2025 saw 997 safety recalls of vehicles, tires, child seats, and equipment, affecting more than 29 million vehicles in the United States. Recall Masters' analysis of the NHTSA data found software and electronics were the largest category at 119 campaigns covering 8.19 million vehicles, with powertrain defects close behind at 87 campaigns and 7.99 million vehicles. In food, the most quoted figure is that the average recall costs $10 million in direct costs, which traces to a 2011 industry survey covered below. Whatever the true average, recall costs are dominated by retrieval and destruction of product, and the brand damage is not in any of these numbers.
The 1-10-100 Rule: What It Says and Where It Came From
The most repeated idea in quality economics is the 1-10-100 rule: it costs $1 to prevent a defect, $10 to correct it internally, and $100 to fix it after it reaches the customer. The version most people quote was written down by George Labovitz and Yu Sang Chang, with Victor Rosansky, in their 1992 book Making Quality Work. It is frequently confused with Barry Boehm's 1976 rule of ten for software defect cost, which makes a similar point about escalation by development phase.
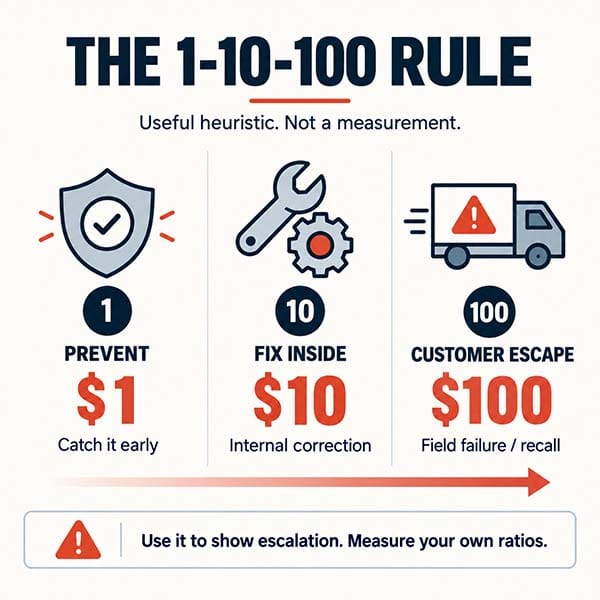
The rule is a heuristic, not a measurement. The authors used it to illustrate escalation, not to report a dataset, and the ratios in your plant will differ. But the shape holds up in practice for a simple reason: every stage a defect survives adds cost and multiplies the number of people who have to touch it. A wrong dimension caught at the machine costs a few minutes. Caught at final inspection, it costs the part. Caught by the customer, it costs the part, the freight, the containment sort, the corrective action report, the customer visit, and the scorecard.
The 1-10-100 rule is an illustration, not a law. The escalation it describes is real. The exact ratios are yours to measure.
Where the Numbers Come From (and Which Ones to Trust)
Here is what most COPQ articles skip. The figures above get repeated so often that their origins have worn off. Before you put one in a business case, know what it rests on.
| The figure you see quoted | Where it actually comes from | What to know before you cite it |
|---|---|---|
| Quality costs run 15% to 20% of sales | ASQ Cost of Quality resource page (earlier versions) and ASQ Quality Press, Principles of Quality Costs | A rule of thumb, not a survey result. The current ASQ page no longer displays the figure. ANSI's summary of ASQ TR2:2024 repeats the 10% to 15% figure for a thriving company. |
| The hidden factory consumes 15% to 40% of capacity | Armand Feigenbaum, Total Quality Control, later editions | An expert estimate, not a measured dataset. Secondary sources report it as 15% to 40% or 20% to 40%. |
| $1 to prevent, $10 to correct, $100 to fail | Labovitz and Chang (with Rosansky), Making Quality Work, 1992 | Illustrative order-of-magnitude heuristic. The authors did not present it as an empirical law. Often confused with Boehm's 1976 rule of ten for software defects. |
| The average recall costs $10 million | GMA survey with Covington & Burling and Ernst & Young, 2011 (food and consumer products) | Self-reported industry survey from 2011. Direct costs only. 23% reported recalls over $30 million. Fifteen years old and never updated. |
| Only 31% fully understand quality cost impact | ASQE 2025 Insights on Excellence Cost of Quality Report | Survey of ASQE benchmarking participants. Self-assessment, not audited financials. |
Table 3: What the most quoted cost of poor quality figures actually rest on.
None of this means the figures are wrong. The ASQ range has survived for decades because plants that actually calculate COPQ keep landing inside it. It means you should cite them as what they are: expert rules of thumb and dated surveys, not measured national statistics. The Warranty Week, NRF, and NHTSA numbers are different. They are compiled from mandatory financial disclosures, retailer surveys with published methodology, and federal recall filings, and they are updated every year. Lead with those.
How to Calculate Your Plant's Cost of Poor Quality
Industry ranges are useful for one conversation with your CFO. After that, you need your own number. Here is a formula that captures the visible and hidden components.
COPQ = Internal Failure Costs + External Failure Costs
Internal Failure Costs = Fully Loaded Scrap + Rework Labor and Machine Time + Re-inspection and Sorting + Downgrades and Concessions + Quality-Caused Downtime + Failure Analysis
External Failure Costs = Warranty Claims + Returns Handling and Credits + Recall Costs + Complaint Handling + Expedited Replacements + Customer Chargebacks and Penalties + Lost Sales
Break each component down:
Fully loaded scrap: For each scrapped unit, total the material plus all labor, machine time, energy, and overhead accumulated through the operation where it was scrapped. Do not use raw material cost. A part scrapped at operation 8 carries the cost of operations 1 through 8.
Rework labor and machine time: Hours spent fixing product, at fully loaded labor rates, plus the machine hours consumed. If rework runs on a constraint machine, value that time at the margin of the product it displaced, not at the machine's hourly rate.
Re-inspection and sorting: Every 100% sort, containment inspection, and re-test triggered by a quality event. Include outside sorting services and the engineering time to write the instructions.
Downgrades and concessions: Product sold as seconds, at a discount, or with a customer waiver. The loss is the price difference times the volume.
Quality-caused downtime: Line stops for quality holds, changeover scrap, and startup scrap after unplanned stops. Use your downtime cost per hour. If you have not calculated it, start with our guide to the cost of unplanned downtime.
Warranty, returns, and recalls: Pull claims paid from finance, not accruals. Add reverse freight, RMA processing, disposition labor, and the credits issued.
Chargebacks, penalties, and lost sales: Customer debits for defective shipments, line-down charges, expedited freight you paid, and (conservatively) the annual margin on any volume a customer moved after a quality escape.
Express the total as a percentage of sales so it can be compared to the ASQ range and tracked over time. Most plants that go through this exercise for the first time find a figure two to three times larger than their scrap report suggested, because the scrap report never included rework, re-inspection, or anything that happened after the dock.
Why Maintenance and Reliability Own More of This Than They Think
COPQ is usually treated as a quality department metric. In most plants, a large share of it is a maintenance metric wearing a different badge.
Equipment condition drives process variation. A spindle with worn bearings holds tolerance on Monday and drifts by Thursday. A hydraulic press with a leaking seal loses tonnage gradually, and the parts it forms creep toward the edge of the specification until one lot falls over it. A packaging line with a misaligned conveyor generates a steady 2% of crushed cartons that nobody logs as a quality loss because the line never stops. None of these show up as failures on a maintenance report. All of them show up in the scrap bin.
Equipment condition drives process variation. Much of what the quality department calls scrap, the maintenance department could have called a work order.
Then there is the startup. Product made in the minutes after an unplanned stop runs at elevated defect rates while temperatures, pressures, and settings stabilize. That scrap is a downtime cost and a quality cost at the same time, and it is usually counted as neither. If your plant experiences unplanned stops weekly, startup scrap alone may be your largest single internal failure category.
The practical implication: your COPQ audit should pull the CMMS work order history alongside the quality records. When scrap spikes on a line correlate with condition monitoring alarms, PM overdue dates, or repeat failures on the same asset, you have found a quality cost that belongs on the maintenance improvement list. The six failure patterns from the Nowlan and Heap study explain why so many of these losses are gradual rather than sudden: most equipment does not fail all at once, it degrades, and the process degrades with it.
Proven Strategies to Reduce the Cost of Poor Quality
The economics of the four buckets point in one direction: move spending from failure to prevention. The highest-return strategies are the ones that stop defects at the source rather than catching them later.
Price scrap and rework at fully loaded cost
Nothing changes behavior faster than replacing the material-cost scrap report with one that shows accumulated value at the point of scrap and adds rework hours. Plants that make this one change typically discover their biggest quality loss is not where they thought it was.
Connect condition monitoring to quality data
Vibration, thermography, and process parameter trends predict quality drift as well as failure. When the reliability team and the quality team share a dashboard, the plant catches the bearing before it makes 4,000 out-of-tolerance parts. See our analysis of whether predictive maintenance is worth the investment for the cost-benefit case.
Mistake-proof the operations that generate repeat defects
Poka-yoke fixtures, sensors that will not let a cycle start with a part seated wrong, and interlocks that stop a machine when a parameter drifts convert a $10 or $100 failure into a $1 prevention cost. Start with the top three defect codes by fully loaded cost.
Tighten PM on quality-critical assets
PM optimization is usually sold on downtime reduction. It pays off on quality too, when PM intervals on the assets that hold tolerance are set by actual condition rather than by OEM defaults written at commissioning.
Close the loop on every escape
Every warranty claim, return for cause, and customer complaint should be traced to a root cause and a corrective action, then back to the equipment, procedure, or material that produced it. If your CMMS and your quality system cannot share a failure code, fix that first.
Run Your Own Cost of Poor Quality Audit
If you have never calculated COPQ for your plant, start with a focused audit. It typically takes three to four weeks and produces a number your leadership team will find hard to ignore.
Pull 12 months of quality records. Scrap tickets, rework orders, nonconformance reports, sorting and containment activity, customer complaints, RMAs, and warranty claims paid. Use finance's numbers where they exist.
Reprice every scrapped unit at fully loaded cost. Use routing data to total the value accumulated through the operation where the part was scrapped.
Estimate rework hours and machine time. If rework is not logged, sample two weeks on the floor and extrapolate. Value constraint machine time at displaced margin.
Add external failure costs. Warranty paid, return credits and reverse freight, recall costs, chargebacks, expedited replacement shipments, and a conservative estimate of lost volume.
Total, express as a percentage of sales, and rank by cause. Rank by defect code, by product, and by asset. The asset ranking is where maintenance and quality find their shared priority list.
The result is a defensible, data-backed figure you can present alongside specific recommendations. In our experience, the number is always larger than anyone expected, which makes the case for prevention spending considerably easier. Our guide to winning ROI approval for maintenance initiatives shows how to turn that number into a funded project.
Frequently Asked Questions
What is the cost of poor quality (COPQ)?
The cost of poor quality is the total cost of defects, both those caught before shipment (internal failure: scrap, rework, re-inspection, sorting, downgrades) and those that reach the customer (external failure: warranty, returns, recalls, complaints, chargebacks, lost sales). It is one half of the cost of quality; the other half is the cost of good quality, meaning prevention and appraisal spending.
What percentage of sales does poor quality cost a manufacturer?
ASQ's long-standing rule of thumb puts quality-related costs at 15% to 20% of sales revenue for many companies, as high as 40% of total operations for poor performers, and 10% to 15% of operations for a thriving company. These are expert estimates, not survey results. Plants that calculate their own COPQ with fully loaded scrap and rework costs typically land inside the ASQ range.
How much do U.S. manufacturers pay in warranty claims?
U.S.-based manufacturers paid $30.37 billion in product warranty claims in 2025, up 4% from 2024, with an average claims rate of 1.30% of product sales, according to Warranty Week's 23rd Annual Product Warranty Report. Rates ranged from 0.42% for semiconductors to 3.5% for Ford in the second quarter of 2025.
What is the 1-10-100 rule in quality?
The 1-10-100 rule states that a defect costs roughly $1 to prevent, $10 to correct internally, and $100 to fix once it reaches the customer. It was published by George Labovitz and Yu Sang Chang in the 1992 book Making Quality Work. It is an illustrative heuristic describing cost escalation, not an empirical law, and actual ratios vary by plant and product.
How do you calculate the cost of poor quality?
Add internal failure costs (fully loaded scrap including all labor and machine time accumulated to the point of scrap, rework labor and machine hours, re-inspection and sorting, downgrades, and quality-caused downtime) to external failure costs (warranty claims paid, return credits and reverse freight, recall costs, complaint handling, chargebacks, expedited replacements, and lost sales). Express the total as a percentage of sales and track it over time.
How does maintenance affect the cost of poor quality?
Equipment condition drives process variation. Worn bearings, leaking seals, misaligned conveyors, and drifting controls produce out-of-tolerance product long before they cause a breakdown, and startup after unplanned stops generates elevated scrap. A COPQ audit that correlates scrap and rework with CMMS work order history and condition monitoring data usually finds that a substantial share of quality losses trace to asset condition.
Sources
American Society for Quality (ASQ). Cost of Quality (COQ). asq.org/quality-resources/cost-of-quality. Adapted from The ASQ Quality Improvement Pocket Guide. The 15% to 20% of sales and 10% to 15% of operations figures appeared in earlier versions of this page and in ASQ Quality Press, Principles of Quality Costs.
2025 Insights on Excellence Cost of Quality Report. American Society for Quality Excellence, 2025.
Feigenbaum, Armand V. Total Quality Control. Harvard Business Review, 1956; and Total Quality Control (McGraw-Hill), later editions, on the hidden plant.
Labovitz, George, Yu Sang Chang, and Victor Rosansky. Making Quality Work: A Leadership Guide for the Results-Driven Manager. HarperBusiness, 1992.
Warranty Week. 23rd Annual Product Warranty Report. April 16, 2026. warrantyweek.com/archive/ww20260416.html.
National Retail Federation and Happy Returns. 2025 Retail Returns Landscape. Press release, October 15, 2025.
National Highway Traffic Safety Administration. Vehicle Safety Resources: Recalls. nhtsa.gov/vehicle-safety-resources; and 2025 Annual Safety Recalls Report, March 2026.
Grocery Manufacturers Association, Covington & Burling LLP, and Ernst & Young. Capturing Recall Costs: Measuring and Recovering the Losses. 2011.