

One in four people working in U.S. manufacturing is 55 or older. In 2025, 3.82 million of the sector’s 15.13 million workers were in that age band, 25.2% of the workforce, against 23.2% across all industries, according to the Bureau of Labor Statistics. In the occupations that keep plants running the share is higher: 27.7% of industrial machinery mechanics, 28.5% of general maintenance and repair workers, 32.3% of the supervisors who lead them, and 36.1% of stationary engineers and boiler operators.
Those percentages describe a plant’s most expensive asset that appears on no balance sheet: the accumulated knowledge of the people who know why the number three compressor trips when the humidity spikes, which valve the drawing shows in the wrong place, and what the previous three attempts to fix the palletizer taught. When they leave, that knowledge leaves with them, and the plant pays for it in longer repairs, repeat failures, and mistakes that were solved once already.
This guide is about that cost. It covers how big the exposure is, what plant knowledge actually consists of, where the loss shows up in the numbers you already track, what the widely quoted statistics on the subject really rest on, and how to run a knowledge-risk assessment before the next retirement party. We will also be clear about a limitation: we could not identify a credible national empirical estimate of the dollar cost of lost plant knowledge, and this article does not invent one.
How Big Is the Exposure?
Three government datasets describe the shape of the problem. None of them measures knowledge directly. Together they show how much experience is near the exit.
Age: the maintenance trades skew old
The BLS Current Population Survey publishes median age and age-band counts by detailed occupation. Table 1 pulls the plant-relevant trades. The pattern is consistent: the roles that generally require the longest time to master, and that tend to carry the most site-specific knowledge, have the oldest workforces. Facilities managers have a median age of 52.7 and more than 40% are 55 or older. Stationary engineers and boiler operators, precision instrument repairers, and first-line maintenance supervisors all exceed 32%.
| Occupation | Employed (thousands) | Median age | Share age 55 and older |
|---|---|---|---|
| All occupations | 163,493 | 42.1 | 23.2% |
| Facilities managers | 128 | 52.7 | 40.6% |
| Precision instrument and equipment repairers | 55 | 47.9 | 36.4% |
| Stationary engineers and boiler operators | 108 | 48.6 | 36.1% |
| First-line supervisors of mechanics, installers, and repairers | 285 | 47.6 | 32.3% |
| Machinists | 309 | 45.7 | 31.4% |
| Maintenance and repair workers, general | 717 | 43.5 | 28.5% |
| Industrial and refractory machinery mechanics | 329 | 45.5 | 27.7% |
| Maintenance workers, machinery | 67 | 46.5 | 25.4% |
| Industrial production managers | 345 | 46.1 | 22.9% |
| Inspectors, testers, sorters, samplers, and weighers | 737 | 41.9 | 22.4% |
| Welding, soldering, and brazing workers | 573 | 39.3 | 20.2% |
| HVAC mechanics and installers | 561 | 39.9 | 18.7% |
| Electricians | 1,063 | 39.6 | 18.0% |
Table 1: Age profile of selected maintenance and plant occupations, 2025 annual averages. Share 55 and older is calculated from the published age-band counts. Source: BLS Current Population Survey, Table 11b. 2025 estimates are 11-month averages that exclude October.
The contrast at the bottom of the table matters too. Electricians, HVAC mechanics, and welders are younger than the workforce average, at 18% to 20% aged 55 and older. One plausible explanation is pipeline: those trades have large, established apprenticeship and trade-school routes, while industrial machinery mechanics, machinists, and maintenance supervisors are more often grown inside a plant over many years. The BLS data shows the age gap; it does not by itself establish the cause.
The industry view tells the same story. Paper manufacturing and printing has a median age of 48.2 with 34.7% of workers 55 or older. Machine shops are at 46.9 and 31.6%. Manufacturing overall is at 43.9, nearly two years older than the all-industry median.
The roles that take longest to master, and carry the most site-specific knowledge, tend to have the oldest workforces. That is the problem in one sentence.
Concentration: firms where a quarter of the workforce is over 55
The Census Bureau’s Business Dynamics Statistics of Human Capital matches worker tax records to firm records and classifies firms by their share of employees over 55. In the utilities sector, the share of employment at firms where at least a quarter of workers are over 55 rose from 35% in 2006 to 80% in 2022. The Census Bureau notes that firms in production sectors such as manufacturing and utilities are among the most likely to have high shares of older workers. The significance is that knowledge loss is not evenly spread. It concentrates in specific firms, and in those firms it concentrates in specific crews.
Timing: Peak 65 and the turnover that surrounds it
More than 4.1 million Americans turn 65 each year from 2024 through 2027, over 11,200 a day, the largest such cohort in U.S. history, according to the Alliance for Lifetime Income’s Retirement Income Institute. That is the tail of the baby boom reaching traditional retirement age. Not all of them retire at 65, and BLS data shows more are working past it. But the window in which a plant can capture what its most experienced people know is closing on a schedule.
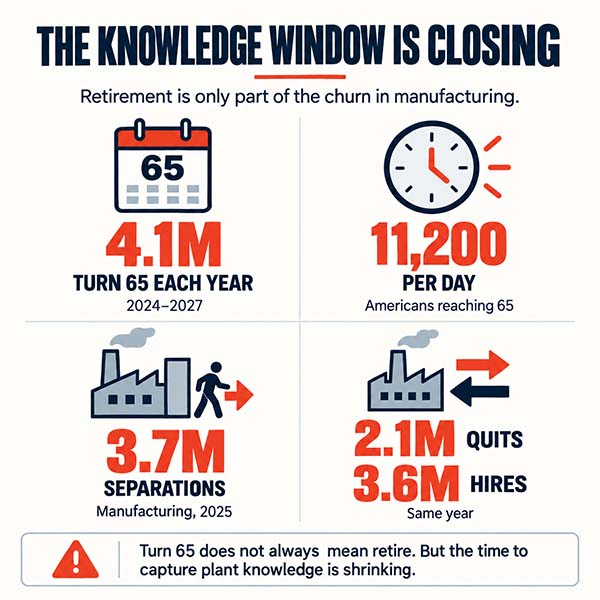
Retirement is only part of the churn. BLS Job Openings and Labor Turnover data shows manufacturing recorded 3.7 million separation events in 2025, including 2.1 million quits, alongside 3.6 million hires. Most of those departures carried some site-specific knowledge out the door, and most of the arrivals brought little of it with them.
What Plant Knowledge Actually Is
Most of what a 30-year millwright knows was never written down, and much of it cannot be. The philosopher Michael Polanyi called this tacit knowledge, and summarized it in a sentence that maintenance managers will recognize: we can know more than we can tell. Tacit knowledge is the pattern a technician hears in a gearbox before the vibration analyzer flags it. It is knowing that the OEM torque spec on the coupling is wrong for the way this machine is mounted. It is the memory of what happened the last time someone tried to run the line at 110%.
Explicit knowledge is the other kind: procedures, drawings, set points, PM task lists, failure histories. It can be written down and, in a well-run plant, it is. The trouble is that the explicit record is usually incomplete, and the gap between what is documented and what is true lives in people’s heads. The drawing shows the valve in the wrong place. The PM says to check the belt tension but not what the right tension feels like. The set point in the recipe was changed six years ago and the recipe was not.
The gap between what is documented and what is true lives in people’s heads. That gap is the cost of lost plant knowledge.
A 2018 survey by Panopto and YouGov of 1,001 U.S. employees at companies with 200 or more workers put a number on the tacit share: respondents estimated that about 42% of the knowledge required for their job was unique to them, not shared by any coworker, and that 51% of what they knew came from personal experience rather than training or documentation. The survey was sponsored by a software vendor, it is self-reported, and it is not specific to plants. Treat the 42% as an illustration, not a measurement. The direction, though, matches what every maintenance manager has seen the first Monday after a senior technician’s last day.
Where the Cost Shows Up
Lost knowledge does not appear as a line item. It appears as small degradations in metrics you already track, spread across enough categories that no one adds them up. Table 2 maps the common ones.
| What the retiree took | What happens on the floor | Where it appears in your data |
|---|---|---|
| Diagnostic pattern recognition | Troubleshooting that took 20 minutes now takes half a shift; more parts swapped on suspicion | Mean time to repair rises on the same failure codes; parts usage per work order climbs |
| Undocumented set points and workarounds | Process drifts after the first restart nobody has done before; the bypass trick is gone | Startup scrap after downtime; quality holds; repeat calls on the same asset |
| Asset history that was never in the CMMS | The same root cause gets rediscovered; a fix that failed in 2014 gets tried again | Repeat failures within 90 days; corrective work orders with no linked history |
| Vendor and OEM relationships | Calls that used to get a same-day answer go to a ticket queue | Longer lead times on emergency parts; more contractor and OEM service spend |
| The reasoning behind the PM program | PM tasks get skipped or deleted because nobody remembers why they exist | PM compliance stays high while failures rise; task lists shrink without an RCM review |
| Safety judgment | Newer hands follow the procedure literally where a veteran would have paused, or improvise where a veteran would not | Safety incidents and near-miss reports broken out by employee tenure |
Table 2: Where lost plant knowledge shows up in the numbers you already collect.
In our experience the largest of these is often the first one. Time to diagnose is where experience pays off most, and it is among the first things to degrade. A repair that a veteran finished in an hour because she had seen the fault twelve times takes a newer technician four hours and two wrong parts. Multiply by the downtime cost of the line and the number is large fast. If you have not calculated what an hour of unplanned downtime costs your plant, start with our guide to the cost of unplanned downtime in manufacturing; every hour added to MTTR by lost knowledge is priced at that rate.
The second largest is repeat failure. Plants that lose their history rediscover it the hard way. The corrective action that did not work in 2014 gets tried again in 2026 because the person who remembered it retired in 2022 and the CMMS closeout note said only ‘repaired.’ Every repeat failure carries the full cost of the failure plus the cost of the investigation that should not have been necessary.
The subtlest is the erosion of the PM program itself. Preventive maintenance tasks accumulate for reasons, and the reasons are rarely recorded. When the person who added the quarterly inspection on the number two hydraulic unit leaves, the inspection looks like waste to whoever reviews the PM list next. It gets cut. Eighteen months later the unit fails the way it did before the inspection was added, and nobody connects the two. Our guide to the six failure patterns from the Nowlan and Heap study explains why so many of these losses are gradual: most equipment does not fail suddenly, and neither does a plant’s knowledge base.
What the Widely Quoted Numbers Rest On
Articles on this topic lean on a handful of statistics that get repeated until their origins wear off. Before you put one in a business case, know what it is.
| The figure you see quoted | Where it comes from | What to know before you cite it |
|---|---|---|
| 10,000 baby boomers retire every day | Pew Research Center estimate of the number turning 65 each day, first published in 2010 | It counts 65th birthdays, not retirements. The Alliance for Lifetime Income puts the 2024 to 2027 figure at more than 11,200 a day, or 4.1 million a year. Many keep working. |
| 42% of an employee's knowledge is unique to them | Panopto and YouGov, Workplace Knowledge and Productivity Report, 2018 | Online survey of 1,001 U.S. employees at firms with 200 or more workers, sponsored by a video-knowledge software vendor. Self-reported. Not manufacturing-specific. |
| Inefficient knowledge sharing costs large companies $47 million a year | Same Panopto report | A model built on the survey's self-reported 5.3 hours a week of waiting and recreating information, applied to a hypothetical large company. Not a measured loss. |
| 1.9 million manufacturing jobs will go unfilled by 2033 | Deloitte and The Manufacturing Institute, Taking Charge, 2024 | A scenario projection, not a forecast: it is the gap if current trends continue and nothing changes. Built on a survey of about 200 manufacturers plus labor data. |
| Replacing an employee costs one-half to two times their salary | Gallup, 2019 | An all-occupation range. Skilled maintenance roles sit toward the high end, but Gallup did not publish a trade-specific figure. |
| One in four manufacturing workers is 55 or older | The Manufacturing Institute, The Aging of the Manufacturing Workforce, 2019 (using 2017 data) | This one holds. BLS 2025 data shows 25.2% of manufacturing workers are 55 or older, up from nearly one-quarter in 2017. |
Table 3: What the most quoted workforce and knowledge-loss figures actually rest on.
The honest summary: the demographic figures from BLS, the Census Bureau, and the Alliance for Lifetime Income are solid and current. The knowledge-share and dollar-loss figures are vendor surveys and models, useful for illustration and unsafe as evidence. If a colleague tells you lost knowledge costs American manufacturing some specific number of billions a year, ask where it came from. We could not find a credible source for any such figure.
Why Maintenance Is the Epicenter
Every department loses knowledge when people leave. Maintenance is unusually exposed, for three reasons.
First, the knowledge is asset-specific. An accountant who moves between companies carries most of what they know with them, because accounting is standardized. A mechanic who has spent 25 years on a particular paper machine knows that machine, its modifications, its history, and its habits. That knowledge has no value anywhere else, and no replacement can bring it in from outside.
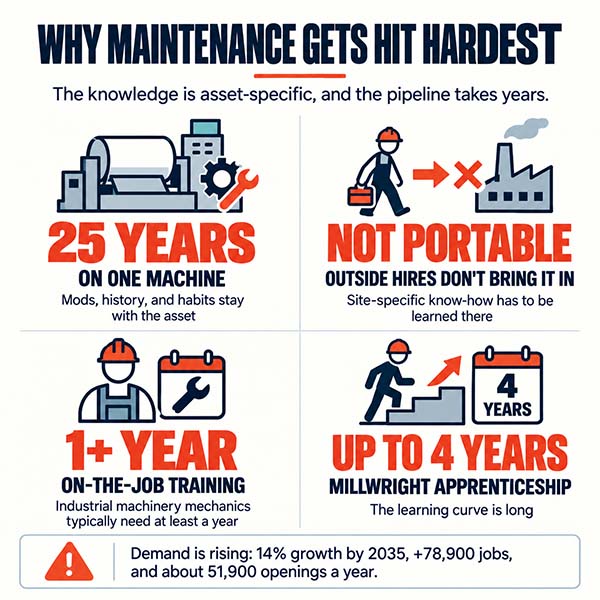
Second, the learning curve is long and the pipeline is thin. BLS reports that industrial machinery mechanics typically need at least a year of on-the-job training after hiring, and that millwright apprenticeships run up to four years. Employment of industrial machinery mechanics, machinery maintenance workers, and millwrights is projected to grow 14% from 2025 to 2035, adding about 78,900 jobs on a 2025 base of 547,300, much faster than the average for all occupations. BLS projects about 51,900 openings a year over the decade, many of them to replace workers who retire or leave the occupation. Demand is rising while the experienced supply is aging out.
Third, maintenance knowledge is the kind that is hardest to write down and easiest to skip writing down. Under pressure to get the line running, the technician fixes the problem and closes the work order with a two-word note. The diagnosis, the dead ends, the thing that finally worked, and the reason it worked all stay in memory. A CMMS with thin closeout notes is a plant that has decided, one work order at a time, not to remember.
A CMMS with two-word closeout notes is a plant that has decided, one work order at a time, not to remember.
The counterpoint is that maintenance also has the best tool for capturing knowledge that any department owns. The work order history, if it is actually written, is the plant’s memory. Our guide to CMMS implementation steps covers how to structure failure codes and closeout fields so that the history is worth reading.
How to Assess Your Plant’s Knowledge-Loss Risk
Because no credible national dollar figure exists that we could identify, the useful exercise is local: identify which people hold knowledge that would be expensive to lose, and how soon you might lose it. A well-documented method comes from the Tennessee Valley Authority, which developed a knowledge loss risk assessment for its nuclear fleet in the early 2000s; the International Atomic Energy Agency published the approach in 2006 and it has since been adapted in other power and process industries. What follows is a practical adaptation of the TVA and IAEA approach for a plant maintenance organization. It scores each position on two factors and multiplies them.
Knowledge-Loss Risk = Attrition Factor x Position Risk Factor
Attrition factor (1 to 5): how soon the person is likely to leave. A 5 means expected departure within a year; a 1 means more than five years out. Use retirement eligibility, stated intentions, and age, and do not guess when you can ask.
Position risk factor (1 to 5): how hard the knowledge is to replace. A 5 means critical, undocumented, site-specific knowledge held by one person with no successor identified. A 1 means documented, procedural knowledge that a qualified hire could pick up in weeks. Consider: Is there a written procedure? Is there a second person who can do it? Does the knowledge depend on this specific plant’s equipment and history? How long would it take to rebuild through training or hiring?
Multiply. In this adaptation, scores of 20 to 25 need a written knowledge-transfer plan now. Scores of 16 to 19 need one within the year. Scores of 10 to 15 go on a watch list. Below 10, standard succession planning is enough. The IAEA publication sets out its own action bands; the thresholds matter less than the discipline of scoring every position and acting on the top of the list.
To translate a high-risk position into dollars for a business case, take the specific losses in Table 2 that apply, and price them with your own data: the added hours of MTTR on that person’s assets times your downtime cost per hour, the cost of a repeat failure you can point to, the contractor spend that would replace their expertise, and the replacement cost of the role, which Gallup puts at one-half to two times annual salary for the general workforce. The result will be an estimate. It will also be defensible, because every component traces to something in your own records.
Proven Strategies to Capture Knowledge Before It Leaves
The organizations that do this well share one habit: they start before the retirement is announced. A knowledge-transfer plan that begins at the exit interview captures almost nothing.
Make the CMMS the plant’s memory
Require closeout notes that record the symptom, the diagnosis, what was tried, and what worked. Use structured failure codes so the history can be searched. Attach photos. This is the cheapest knowledge capture available and most plants skip it.
Start knowledge interviews three years out
Sit down with each high-risk position holder and walk their assets. Ask what fails, what the drawings get wrong, what they check that is not on the PM, and what they would tell their replacement. Record it. One two-hour session per critical asset, done annually, builds a library that no exit interview can match.
Pair and shadow deliberately
Assign each senior technician a named successor and schedule them on the same jobs. Make the senior person narrate the diagnosis aloud. Tacit knowledge transfers through repetition alongside an expert, not through documents.
Convert tribal PMs into written ones
Every PM task should carry a one-line reason: what failure it prevents, and what triggered its creation. A PM list with reasons attached survives a review. One without reasons gets cut. Our guide to how PM optimization transforms reliability covers the review process.
Use phased retirement and retiree contracts
A retiring expert who works two days a week for a year, or who is on a call-back contract for the first 12 months, is inexpensive insurance against the first big failure after their departure. Structure it before the last day, not after the first crisis.
Record the troubleshooting, not just the procedure
Short videos of an expert diagnosing a real fault on the actual machine, shot on a phone, capture things a written manual cannot. They capture what the expert looks at, listens for, and rules out. Store them against the asset in the CMMS.
Run Your Own Knowledge-Risk Audit
If your plant has never assessed its knowledge exposure, a focused audit takes two to three weeks and produces a ranked list your plant manager cannot ignore.
- List every maintenance, operations, and engineering position, with the incumbent’s tenure and retirement eligibility. Pull this from HR; do not estimate ages.
- Score each position on the attrition factor and the position risk factor, 1 to 5 each, using the criteria above. Involve the maintenance supervisor and a senior operator; they know who the plant cannot lose.
- Multiply and rank. Anything at 16 or above goes on the action list.
- For each action-list position, inventory what exists: procedures, drawings, CMMS history, training records. The gaps are your knowledge-transfer plan.
- Price the top five using your own downtime cost, repeat-failure history, and replacement cost. Present the ranked list, the exposure estimate, and the transfer plan together. Our guide to winning ROI approval for maintenance initiatives shows how to structure the ask.
In our experience, plants that do this for the first time usually find a few positions where a single retirement would remove the only person who understands a critical asset. Finding them before the retirement is the whole point.
Frequently Asked Questions
How much does lost plant knowledge cost?
We could not identify a credible national empirical estimate. The cost appears locally as longer repair times, repeat failures, higher contractor and OEM spend, PM programs that erode, and safety incidents among newer workers. It can be estimated for a specific plant by pricing those effects with the plant’s own downtime cost, failure history, and replacement cost. Widely quoted figures such as $47 million per year for a large company come from vendor models, not measured data.
What share of the manufacturing workforce is near retirement?
In 2025, 25.2% of U.S. manufacturing workers were 55 or older, according to the BLS Current Population Survey, compared with 23.2% across all industries. In maintenance-specific occupations the share is higher: 27.7% of industrial machinery mechanics, 28.5% of general maintenance and repair workers, 32.3% of first-line maintenance supervisors, and 36.1% of stationary engineers and boiler operators.
What is tacit knowledge in a maintenance context?
Tacit knowledge is what experienced people know but cannot fully write down: recognizing a fault by sound, knowing which drawings are wrong, remembering what was tried before and why it failed, and judging when a procedure should not be followed literally. It is distinct from explicit knowledge such as procedures, set points, and CMMS records. Tacit knowledge transfers mainly through working alongside an expert.
Is it true that 10,000 baby boomers retire every day?
Not exactly. The 10,000 figure, from a 2010 Pew Research Center estimate, counts people turning 65 each day, not people retiring. The Alliance for Lifetime Income estimates more than 11,200 Americans turn 65 daily from 2024 through 2027, about 4.1 million a year. Many continue working past 65, so daily retirements are lower than either number.
How do you assess knowledge-loss risk in a plant?
A well-documented method, developed at the Tennessee Valley Authority and published by the IAEA in 2006, scores each position on an attrition factor (how soon the person is likely to leave, 1 to 5) and a position risk factor (how critical and hard to replace the knowledge is, 1 to 5), then multiplies them. In the adaptation described in this article, scores of 16 or higher need a knowledge-transfer plan within the year.
What is the best way to capture a retiring technician’s knowledge?
Start years before the exit. Require CMMS closeout notes that record diagnosis and resolution, conduct recorded knowledge interviews on each critical asset, pair the expert with a named successor on real jobs, attach a written reason to every PM task, record short videos of real troubleshooting, and use phased retirement or call-back contracts for the first year after departure.
Sources
- S. Bureau of Labor Statistics. Current Population Survey, Table 11b, Employed people by detailed occupation and age, 2025 annual averages; and Table 18b, Employed people by detailed industry and age, 2025 annual averages. bls.gov/cps.
- S. Bureau of Labor Statistics. Job Openings and Labor Turnover, January 2026, with 2025 annual estimates. Release USDL-26-0439, March 13, 2026.
- S. Bureau of Labor Statistics. Occupational Outlook Handbook: Industrial Machinery Mechanics, Machinery Maintenance Workers, and Millwrights. 2025 to 2035 projections.
- S. Census Bureau. Firms in Production Sectors and Northern States Have Some of the Highest Shares of Older Workers. Business Dynamics Statistics of Human Capital, December 2025.
- Alliance for Lifetime Income, Retirement Income Institute. The Peak 65 Zone is Here: Creating a New Framework for America’s Retirement Security. Jason Fichtner, January 2024.
- Deloitte and The Manufacturing Institute. Taking Charge: Manufacturers Support Growth with Active Workforce Strategies. April 2024.
- The Manufacturing Institute. The Aging of the Manufacturing Workforce. 2019.
- Panopto and YouGov. Workplace Knowledge and Productivity Report. 2018.
- This Fixable Problem Costs U.S. Businesses $1 Trillion. 2019.
- International Atomic Energy Agency. Risk Management of Knowledge Loss in Nuclear Industry Organizations. IAEA, Vienna, 2006. Describes the Tennessee Valley Authority knowledge loss risk assessment method.
- Polanyi, Michael. The Tacit Dimension. University of Chicago Press, 1966.