
When Benchmarking Becomes a Blindfold
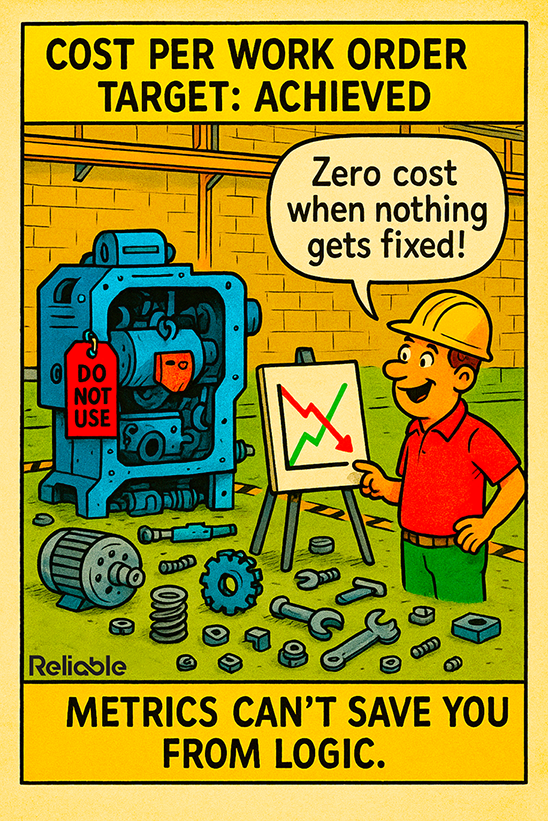
Maintenance benchmarking metrics are supposed to illuminate performance gaps, highlight efficiency opportunities, and guide improvement. Yet too often, they obscure reality. The cartoon perfectly illustrates this truth: a maintenance team proudly declares victory after achieving a “zero cost per work order” target, simply because no repairs are being done.
When metrics replace logic, illusions of success replace real reliability.
This absurdity isn’t rare. Plants everywhere celebrate the wrong numbers: declining maintenance costs, fewer work orders, shorter downtime. But these improvements are often illusions. The focus drifts from asset reliability to performance optics. Maintenance metrics meant to reveal the truth instead create a distorted mirror —one that reflects what management wants to see, not what’s actually happening.
The problem isn’t with benchmarking itself, it’s with how it’s applied. Metrics detached from logic are dangerous. They drive compliance, not understanding. Actual improvement requires context, reasoning, and alignment between what’s measured and what actually matters.
How Maintenance Benchmarking Metrics Go Off Course
Maintenance benchmarking metrics fail when they become ends rather than means. Consider a plant comparing its maintenance spend to a peer facility’s and deciding to cut costs by 20%. On paper, that’s progress. In practice, it often means reducing preventive maintenance, ignoring minor defects, and pushing equipment harder, all under the illusion of efficiency.
Benchmarking should never become mimicry. Every facility operates under unique conditions:
- Different operating environments (temperature, dust, humidity).
- Different equipment ages and duty cycles.
- Different maintenance philosophies and staffing structures.
Without adjusting for these factors, comparisons are meaningless. A 3% maintenance cost ratio might indicate excellence in one plant and negligence in another. The logic behind the data is what gives metrics value.
When maintenance benchmarking metrics drive the wrong behaviors, they corrode reliability culture. Teams start optimizing for numbers instead of outcomes, leading to what some call “Excel reliability”—great reports, terrible machines.
Restoring Logic to Maintenance Benchmarking Metrics
Benchmarking done right blends quantitative measurement with qualitative interpretation. It’s not just about knowing what is happening, but why. The key lies in context and logic.
To ensure benchmarking delivers insight instead of confusion, reliability leaders should:
- Normalize the data. Account for differences in production scale, maintenance hours, and equipment types before comparing.
- Correlate metrics to asset performance. Ensure the measure aligns with actual reliability outcomes, such as uptime, MTBF, or risk reduction.
- Interpret patterns, not points. Trends over time are more meaningful than snapshots. A single good quarter doesn’t define improvement.
- Balance leading and lagging indicators. Lagging metrics (like failure rates) tell what happened; leading ones (like PM compliance) predict what’s coming.
When teams apply these principles, maintenance benchmarking metrics become a compass instead of a scoreboard. They identify root causes, inform strategic decisions, and align maintenance objectives with business outcomes.
From Comparison to Collaboration: Benchmarking for Reliability Growth
The goal of maintenance benchmarking metrics shouldn’t be to outperform others—it should be to learn from them. The most advanced organizations treat benchmarking as a learning exchange, not a competition. They use external metrics as references but build internal metrics that drive accountability and logic-based improvement.
Examples of productive benchmarking collaboration include:
- Cross-plant learning networks where facilities share KPIs and improvement strategies.
- Peer reliability audits to assess whether process gaps, not people, explain differences.
- Joint data reviews that focus on problem-solving rather than blame or scorekeeping.
When benchmarking is paired with shared learning, it shifts from pressure to progress. Instead of chasing unrealistic numbers, maintenance teams build adaptive systems that evolve with data. The logic returns to the center of decision-making, reinforcing reliability as a culture rather than a metric.
Integrating Maintenance Benchmarking Metrics with Broader KPIs
To make benchmarking more meaningful, it must connect with broader maintenance and reliability frameworks. Combine maintenance benchmarking metrics with reliability-centered KPIs such as:
- Planned vs. unplanned maintenance ratio (indicates control and predictability).
- Maintenance schedule compliance (measures process discipline).
- Mean time between failures (MTBF) (tracks equipment health trends).
- Maintenance backlog management (reveals resource balance and risk exposure).
Blending benchmarking with these KPIs provides a multi-dimensional view of maintenance maturity. It prevents overemphasis on cost alone and highlights where systems are strengthening or eroding. This integrated model also drives strategic decisions, helping leadership allocate budget where it actually improves reliability instead of just trimming expenses.
Integrating Maintenance Benchmarking Metrics into a Data-Driven System
To maximize the value of maintenance benchmarking metrics, use them within a data-driven maintenance management system. Combine reliability KPIs, preventive maintenance performance indicators, and asset performance analytics into a single dashboard. Align maintenance benchmarking metrics with production KPIs and energy-efficiency measures to understand how maintenance practices affect the entire operation. This integrated approach prevents metric silos and ensures benchmarking reflects total reliability performance.
Turning Maintenance Benchmarking Metrics into Actionable Insights
Collecting maintenance benchmarking metrics is only the beginning; real value comes from interpretation and execution. Too many organizations stop at data collection, creating impressive dashboards that never translate into change. To make benchmarking actionable, maintenance leaders must transform raw data into operational intelligence that guides daily decision-making.
Data without interpretation is decoration; only when metrics drive action do they create reliability.
Start by identifying which metrics most directly influence reliability outcomes. For example, improvements in planned work percentage or PM compliance often yield measurable gains in uptime and energy efficiency. Connect each maintenance metric to a specific action plan—what behavior will this metric drive, and how will progress be validated? This closes the loop between measurement and improvement.
Trend analysis is another overlooked practice. Isolating year-over-year changes in maintenance benchmarking metrics provides more insight than static comparisons. Tracking performance across time highlights whether processes are stabilizing or eroding. Pair this with root cause analysis (RCA) to determine why certain KPIs are moving. If MTBF improves, was it due to better lubrication practices, updated training, or improved scheduling discipline? Knowing why performance shifts is the difference between data awareness and operational intelligence.
Next, ensure that benchmarking insights are shared across departments. Production, engineering, and maintenance should interpret data together to eliminate blind spots. Benchmarking in isolation breeds conflict; shared interpretation builds alignment. When a maintenance team reports rising work order costs, for example, production might reveal that the cause was longer changeovers or batch-size shifts, not poor maintenance efficiency. This cross-functional view prevents knee-jerk reactions to metrics and encourages strategic collaboration.
Finally, use benchmarking results to establish continuous improvement loops. After analyzing trends, develop action plans with measurable goals and revisit those metrics quarterly. Automate data gathering where possible using CMMS or EAM integrations to reduce reporting friction. Incorporating predictive analytics further strengthens this loop, turning static benchmarking into a proactive reliability forecasting tool.
When maintenance benchmarking metrics evolve from reports to roadmaps, they become catalysts for transformation. Plants that execute on insights instead of admiring dashboards consistently outperform peers, not because they have better data, but because they apply better logic to interpret and act on it.
Logic: The Ultimate Benchmark
The humor in the cartoon lands because it’s true—when organizations chase the wrong goals, absurd outcomes become normal. A plant that stops fixing equipment to reduce maintenance costs is perfectly “efficient” right up until it fails catastrophically.
Logic must always come before metrics. Numbers don’t think, but people do. Metrics measure what happens; logic explains why it happens. The best reliability cultures use data as a dialogue, not a dictatorship. They understand that success isn’t defined by achieving the lowest maintenance cost; it’s about reaching the highest operational integrity.
When logic drives benchmarking, numbers become powerful allies; when it doesn’t, even the most sophisticated metrics turn into traps.