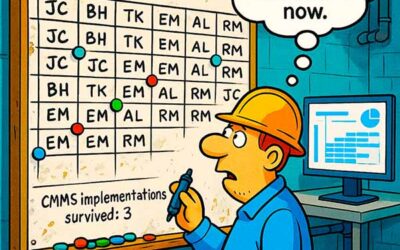
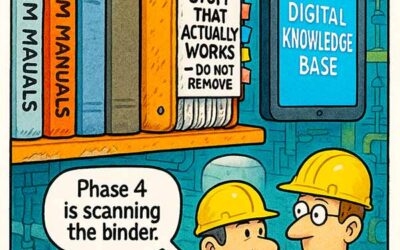
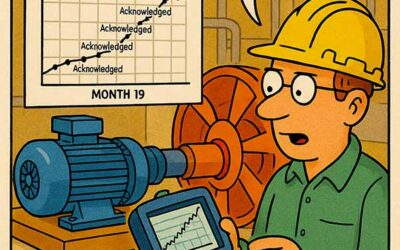
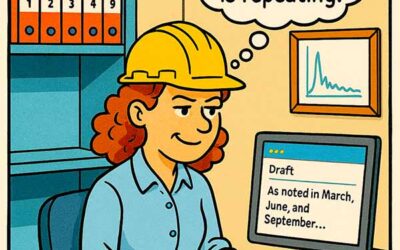
A reliability engineer can finish the year with a shelf of polished root cause analyses and a plant that fails about as often as it did in January. The binders are thorough and well organized. The failures kept arriving on their old schedule anyway, which is the part the shelf does not explain.
That is the uncomfortable core of how to measure reliability engineer performance. Investigation is easy to count, prevention is hard to see, and a scorecard built on the easy number quietly rewards the wrong work while everyone nods at the pile of reports.
The stakes here are practical. Reliability engineering is meant to reduce asset-related risk and improve performance by preventing, mitigating, or detecting failure modes. A measurement system that counts documentation but misses those outcomes can slowly turn a prevention role into a reporting role without anyone deciding to make the trade.
Why Reliability Engineers Drift Toward Documentation
The drift is understandable when you watch how the days fill up. An investigation has a clear beginning and end, it produces a document, and the document proves effort to anyone who asks. Prevention shows up as an absence, and an absence is a hard thing to celebrate in a performance review.
The trap catches good people. Ask a top reliability engineer what they did last quarter and you may hear a count of analyses rather than a list of failure modes retired for good. The role was defined around prevention, yet the calendar fills up with forensics on failures that already happened.
A stack of excellent investigations can sit on a shelf while the same pump fails on schedule, because analysis creates value only when findings become effective action.
Organizations reinforce the drift without meaning to. Each new breakdown creates fresh demand for another investigation, and the queue never quite empties. The engineer gradually becomes the plant’s historian, explaining failures with real skill long after the damage is done.
If the reliability numbers barely move through all of it, the gap is usually somewhere between understanding the failure and changing the conditions that produce it. A report by itself cannot cross that gap, and a measurement system should point straight at it.
The Metrics That Measure Motion Instead of Results
A scorecard tends to fill with whatever is easy to pull from a system. Number of investigations completed, reports issued, meetings attended, and actions logged all line up neatly in a spreadsheet. Each of those is genuine activity, yet none of it proves a single failure was actually prevented.
Activity metrics feel fair because they are countable and easy to audit. Their weakness is that a busy quarter and a productive quarter can look similar on the chart. A plant can be full of thorough, well-written reports and still lose ground on the equipment that matters.
The deeper problem is direction. A metric that rewards investigation volume can pull the engineer toward producing more reports without giving equal weight to implementation and effectiveness. The scorecard can end up steering effort toward the activity that is easiest to count.
Managers rarely land on these metrics out of laziness. They land on them because the data is already sitting in the system and the reporting deadline is real and close. The remedy is to add one or two outcome measures that are worth the extra effort it takes to collect them.
How to Measure Reliability Engineer Performance
Better measurement starts by following the work past the report and into the plant itself. The question shifts from how many investigations were completed to whether important failure modes were eliminated, reduced, or better controlled, and whether the changes held.
Anchor the scorecard to outcomes within the engineer’s assigned scope and influence. Reliability KPIs such as repeat-failure rate, recurrence on bad actors, unplanned downtime from targeted failure modes, and MTBF where failure definitions and operating exposure are consistent can show whether prevention is working. Read them with production rate, duty cycle, and other context that can move the numbers independently of the engineer’s work.
Measure reliability engineering by failure risk reduced, recommendations that became controlled changes, and repeat failures that declined or disappeared.
Pair activity measures with outcome measures so the two are read together. Treat report issuance as an intermediate milestone, then give more weight when recommended actions are approved, implemented, and checked for effectiveness over a window suited to the failure mode. That keeps the scorecard pointed toward prevention without pretending every recurrence can be eliminated.
Investigation quality should be judged by the evidence behind the causal chain, the quality of the selected actions, and whether those actions are verified to work. A failure not returning is useful evidence, but absence alone does not prove the analysis was correct, especially for infrequent failures.
Close the Loop From Analysis to Change
The gap between a finished analysis and a changed plant is where reliability effort can quietly leak away. A recommendation that lands in a report and waits months for a decision has prevented nothing yet, however sound it looks on paper.
Track the fate of each recommendation as carefully as the investigation itself. Watch the plant’s bad actors and the failure modes the engineer has actually targeted, then check whether recurrence or risk is moving in the right direction after the changes. If the same addressed problems keep returning, the loop is still open.
Closing the loop is a discipline more than a tool. It means each accepted action has a named owner, a target date, and a way to confirm the change produced the intended effect on the equipment or risk it targeted.
Verification is easy to skip. Confirming that a change actually worked requires a deliberate follow-up after enough operating exposure has accumulated, often when attention has moved on to the next fire. Schedule that check like any other task or it can fall through the cracks.
- Each accepted action has an owner, a due date, and a verification step.
- Implemented changes are checked against the failure mode or risk they were meant to address.
- Repeat failures on addressed modes are reviewed to determine whether the causal model, action, or operating context has changed.
Count the Failure That Never Came Back
Prevention is invisible by its nature, which is exactly why it needs deliberate accounting. When a failure mode is eliminated, nothing happens, and nothing is famously difficult to put on a slide for management.
Use baselines and recurrence tracking, but normalize them for operating exposure where it matters. Record how often a defined failure occurred before the change, apply the action, then watch the interval or failure rate afterward. If a failure that used to appear every eight weeks stays away for a year under comparable duty, that is strong evidence the work helped.
One of the strongest measures of reliability engineering is the failure that stopped recurring, counted against the baseline and operating exposure it used to follow.
Fair measurement also requires attribution. Separate outcomes on assigned assets and targeted failure modes from broader changes in production, maintenance execution, operating context, and random variation, rather than assigning every plant failure or every quiet month to one engineer.
Over a full year, verified risk reduction or eliminated recurrence on critical failure modes should weigh more heavily than a large stack of reports on problems that returned. That comparison tells a manager whether the role is producing durable change, not just documentation.
Leading Indicators Worth Watching
Lagging measures such as downtime or recurrence confirm progress late, so pair them with leading indicators that move sooner. Useful leading signals track the flow from a finding to an approved, implemented, and verified action before failure statistics have had time to react.
These signals show whether the prevention process is moving while the reliability outcomes are still developing. They also give the engineer a current picture of the work instead of a single verdict delivered once a year.
Leading indicators work alongside lagging outcomes rather than in place of them. Read together, they show both whether the prevention process is moving and whether the plant results eventually follow.
- Share of approved recommendations implemented within their target window.
- Median time from an approved high-priority finding to implemented action.
- Share of implemented actions that receive the planned effectiveness check.
Give the Engineer Room to Prevent
Measurement changes behavior only when the job actually allows the behavior it measures. An engineer buried under mandatory investigations has little time left to implement anything, so the scorecard and the weekly schedule have to agree with each other.
Protect time for prevention work the way a plant protects other critical work. Give the engineer a defined path to propose and implement approved changes to PM tasks, specifications, operating practices, or designs, using the site’s engineering, safety, and management-of-change controls where they apply. Without that support, recommendations pile up while failures carry on.
An engineer measured on prevention needs the time, access, and a workable path to approved change, or the scorecard becomes a list of good ideas that nobody implemented.
The manager’s job is to keep the loop short enough that a finding can turn into a properly reviewed, funded change while the evidence is still fresh. Timely action teaches the team that investigations lead somewhere real.
Do that consistently and the annual review changes character. The conversation moves from how many failures were documented to how reliability risk moved, which actions held, and which repeat failures finally stopped coming back.