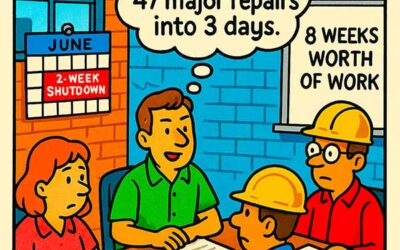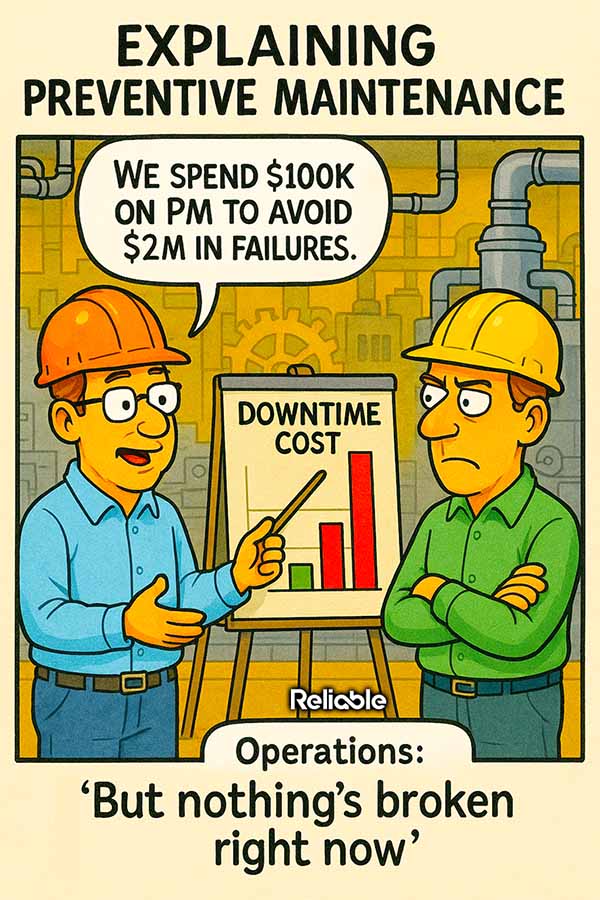

Every maintenance manager has faced the same blank stare. You walk into a budget meeting with a proposal for preventive maintenance spending, and someone across the table says, “But nothing’s broken.” Knowing how to justify preventive maintenance costs in that moment separates programs that get funded from programs that get cut.
The logic seems airtight from their side. Equipment is running. Production numbers look fine. Why pour money into fixing things that work? Preventive maintenance keeps working equipment from failing catastrophically, expensively, and at the worst possible time. That’s the entire value proposition, and it requires spending money before problems become visible.
The Real Price of “Nothing’s Broken”
Unplanned downtime in manufacturing averages $260,000 per hour, according to Aberdeen Research. That’s the number most people cite, and it’s dramatic enough to get attention. But the real cost hides in smaller, more insidious places.
Consider what happens when a single bearing fails on a critical conveyor. The bearing itself costs $45. The emergency parts run, overtime labor, express shipping, and four hours of lost production? That bill lands closer to $18,000. A scheduled replacement during a planned shutdown would have cost $200 in labor and the same $45 part.
A $45 bearing replacement during a planned shutdown costs $200 in labor. The same bearing failing unexpectedly costs $18,000 in emergency response, overtime, and lost production.
These ratios repeat across every asset class. Pumps, motors, gearboxes, HVAC systems: the reactive repair consistently costs 5 to 10 times what the preventive task would have. That multiplier is where the business case lives.
How to Justify Preventive Maintenance Costs with Hard Data
Vague appeals to “best practice” won’t survive a budget meeting. Finance teams want numbers, and they want those numbers tied to outcomes they care about: production uptime, cost avoidance, and asset lifespan.
Start by pulling your last 12 months of work orders. Separate them into planned and unplanned categories. For each unplanned repair, document three things:
- Total cost of the repair, including parts, labor, contractors, and any expedited shipping fees.
- Duration of the downtime and what production was lost or delayed during that window.
- Whether a preventive task existed for that asset and, if so, whether it was current or overdue.
This exercise almost always reveals a pattern. The assets with lapsed or nonexistent PM schedules generate the most emergency work orders. That correlation is your argument.
Finance teams don’t fund philosophies. They fund proposals backed by 12 months of work order data showing exactly where reactive repairs are bleeding money.
Once you have the data, frame the proposal as cost avoidance rather than cost addition. Leadership responds much better to hearing that $100,000 in PM will prevent $400,000 in unplanned repairs and production losses. Same number, completely different reception.
Building the One-Page Business Case
Keep the proposal to a single page. Executives skim, and a 20-slide deck signals that you’re padding. Your one-pager needs four sections:
- Current state: total unplanned downtime hours and costs over the past year, broken down by asset or area.
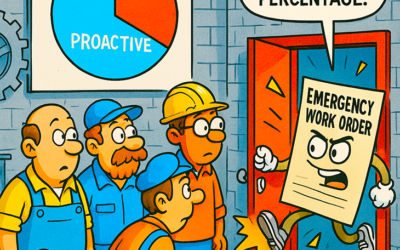
- Root cause: percentage of those failures that a preventive task would have caught or prevented entirely.
- Proposed investment: the annual cost of the PM program, including labor hours, parts inventory, and any technology (CMMS, sensors) needed.
- Expected return: projected reduction in unplanned downtime, with a conservative estimate (nobody believes 100% elimination, so aim for 30 to 50% reduction in year one).
The math should be simple enough that someone can verify it in their head during the meeting. If your projected savings are four times the investment, you don’t need elaborate charts to make the point.
Overcoming the “If It Ain’t Broke” Objection
The most stubborn resistance to PM spending comes from operations leaders who’ve spent years running equipment until it fails. Their experience tells them that things mostly work out. And they’re right, until they aren’t.
One approach that works: pick one critical asset that’s currently running without a PM schedule. Pull its repair history. Show how much has been spent on reactive fixes over the past three years. Then present what a basic PM schedule for that single asset would cost annually.
This micro-case is harder to argue with than a plant-wide proposal. It’s concrete, it’s specific, and it usually reveals a cost ratio embarrassing enough to shift the conversation.
Start with one critical asset, not the whole plant. A single embarrassing cost ratio does more to shift budget conversations than any enterprise-wide proposal.
Another common objection: “We don’t have the staff for PM.” This one deserves a direct answer. Plants running reactively have every technician tied up chasing emergencies, which creates the illusion of a staffing shortage. A functioning PM program reduces the emergency workload, which frees capacity for planned work. The staffing squeeze is a symptom of reactive operations, and it eases as planned work takes hold.
Tracking Results to Protect Future Budgets
Getting the initial funding is half the battle. Keeping it requires proof that the money was well spent. Set up simple tracking from day one:
- Monthly ratio of planned vs. unplanned work orders (target: 80% planned).
- Total unplanned downtime hours compared to the same period before the PM program launched.
- Cost per work order, planned vs. unplanned, tracked as a rolling average.
Report these numbers quarterly to the same people who approved the budget. When they see unplanned downtime dropping and cost-per-repair shrinking, the following year’s budget conversation gets much shorter.
Aligning Maintenance and Operations Language
One reason PM proposals stall is that maintenance and operations speak different languages. Maintenance talks about failure modes and mean time between repairs. Operations talks about throughput, yield, and schedule adherence. The same PM program that “reduces bearing failures by 40%” also “increases line availability by 6%.” Pick the framing your audience cares about.
At one food processing plant, the maintenance director reframed his PM proposal entirely around food safety audit scores. Unplanned equipment failures had caused three near-misses during FDA inspections over two years. Framing PM as audit risk mitigation unlocked the budget in a single meeting. The technical justification was identical; the vocabulary made it land.
This kind of translation is part of knowing how to justify preventive maintenance costs effectively. The data tells you whether the program works. The language you wrap around that data determines whether anyone listens.
The Long Game
Learning how to justify preventive maintenance costs is really about learning to speak finance. Maintenance professionals think in terms of equipment health, failure modes, and mean time between failures. Finance thinks in terms of risk, return, and capital allocation. The argument stays the same; only the vocabulary changes.
Plants that invest in PM consistently outperform those that run reactively, with 10 to 20% higher overall equipment effectiveness and significantly lower maintenance cost per unit of production. Those numbers compound over years as assets last longer, production runs smoother, and emergency spending drops.
The next time someone says “nothing’s broken,” you’ll have the data to show them what that silence is actually costing.