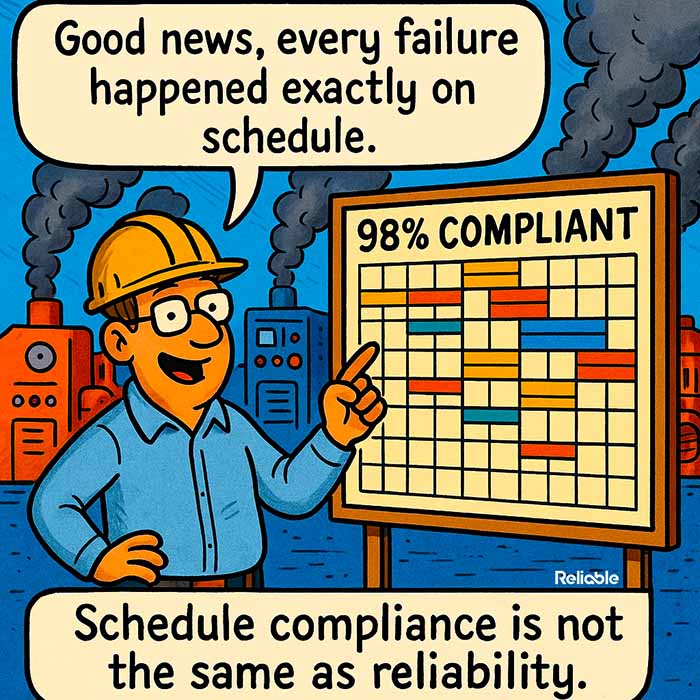

A maintenance department hits 95% schedule compliance and celebrates. Two weeks later, a critical pump fails catastrophically. The bearings were shot. The seals were leaking. The last three PMs on that pump were completed “on time,” according to the CMMS. The disconnect between schedule compliance vs equipment reliability is one of the most common blind spots in maintenance management, and one of the most expensive.
High schedule compliance feels like proof that the maintenance program is working. The numbers are up. The reports look good. Leadership is happy. But compliance measures whether tasks were completed on time. It says nothing about whether those tasks actually improved equipment condition.
What Schedule Compliance Actually Measures
Schedule compliance, at its core, tracks one thing: did the planned work get done within the planned window? A typical target is 90% or higher. When a plant reports 95% compliance, that means 95 out of every 100 scheduled tasks were completed on time.
That’s useful information. It tells you the planning and scheduling process is functional, that crafts are available, that parts are being staged, and that work is getting prioritized. Those are all prerequisites for a good maintenance program.
Schedule compliance tells you the maintenance machine is running. It tells you nothing about whether the machine is producing results.
The metric breaks down when people assume completion equals effectiveness. A technician can complete a PM in the allotted time, check every box on the task list, and still leave the asset in declining condition. If the PM procedure itself is inadequate (wrong tasks, wrong intervals, wrong inspection criteria), perfect compliance just means you’re executing a flawed plan flawlessly.
The Compliance Illusion
Here’s where the gap between schedule compliance vs equipment reliability gets dangerous. A plant can run 90%+ compliance for years while its equipment condition steadily deteriorates. The numbers mask the decline because they measure activity, and activity always looks productive.
Common ways compliance stays high while reliability drops:
- PM procedures contain only visual inspections and lubrication, missing the failure modes that actually drive breakdowns
- Task lists were written decades ago and never updated to reflect current operating conditions or equipment modifications
- Technicians rush through PMs to hit schedule targets, completing paperwork without doing thorough inspections
- High-priority corrective work gets reclassified as planned work to inflate compliance numbers
That last one is more common than anyone likes to admit. When a reactive repair gets entered into the schedule the same day it’s performed, it technically counts as “scheduled and completed.” The compliance number goes up. The underlying problem (reactive work is too high) stays invisible.
The Real Gap Between Schedule Compliance vs Equipment Reliability
Equipment reliability shows up in different metrics entirely: mean time between failures (MTBF), overall equipment effectiveness (OEE), unplanned downtime percentage, and emergency work order ratio. These numbers describe outcomes. Schedule compliance describes process.
The healthiest maintenance organizations track both and look for alignment. When compliance is high and MTBF is trending upward, the program is working. When compliance is high and failures keep occurring, something in the process is broken, even if the process itself is running on schedule.
A 95% compliance rate paired with a rising failure rate is a signal worth investigating immediately.
The investigation usually points to one of three root causes: the wrong work is being scheduled, the right work is being done poorly, or the intervals between tasks are mismatched to the actual degradation patterns of the equipment.
Wrong Work, Right Schedule
Many PM programs are built on time-based intervals inherited from OEM manuals or industry rules of thumb. Monthly greasing. Quarterly filter changes. Annual overhauls. These intervals may have made sense when the equipment was new, but operating conditions change. Loads shift. Process chemistry evolves. Environmental factors fluctuate.
A PM program that hasn’t been reviewed through a formal process like reliability-centered maintenance (RCM) or failure modes and effects analysis (FMEA) is essentially running on assumptions. If those assumptions are wrong, perfect schedule compliance just locks in the wrong work at the wrong time. How to Perform RCM offers a structured path to fixing this.
Consider a cooling water pump that gets a quarterly PM consisting of a visual check and a grease application. The failure mode killing that pump is actually shaft seal degradation driven by process water contamination. The PM addresses neither the failure mode nor the operating context. The compliance score stays perfect. The pump fails every 14 months like clockwork.
Perfect compliance on the wrong PM is indistinguishable from doing nothing, except it costs labor hours.
Fixing this requires going back to the equipment’s actual failure history and matching preventive tasks to real failure modes. That’s harder than writing a generic PM procedure, but narrowing the divide between schedule compliance and equipment reliability requires exactly this kind of targeted effort.
Right Work, Poor Execution
Even when the PM procedures are sound, execution quality varies enormously. A vibration reading collected by a trained analyst with a properly mounted sensor produces actionable data. The same reading collected by someone who held the sensor against the housing by hand produces noise.
Execution quality problems tend to hide behind compliance numbers because the task technically got done. The checkbox is checked. The data field is populated. But the value of the work product ranges from excellent to useless depending on who did it and how.
Signs that execution quality is undermining your reliability despite strong compliance:
- Condition monitoring data shows no clear trends (flat, noisy baselines suggest inconsistent collection techniques)
- PM completion times are suspiciously uniform across different asset types and complexity levels
- Follow-up work orders from PMs are rare, suggesting inspections are cursory or findings go unreported
- The same equipment keeps failing between PM intervals despite on-time task completion
Addressing execution quality requires investment in training, procedure detail, and supervision. Plants that take the effort to improve maintenance schedule compliance recognize that compliance without quality is just paperwork with a deadline.
Bridging the Gap: Metrics That Actually Track Reliability
If schedule compliance alone can’t tell you whether your equipment is getting more reliable, what can? The answer is a small set of outcome metrics tracked alongside compliance to give the full picture.
The most useful pairing:
- Schedule compliance (process metric): tracks whether planned work gets done on time. Target: 90% or higher.
- Emergency work order percentage (outcome metric): tracks how much work is reactive. Target: below 10% of total work orders.
- PM effectiveness ratio (outcome metric): tracks what percentage of PMs generate follow-up corrective work orders. A healthy range is 10% to 30%, meaning inspections are actually finding things.
- Mean time between failures (outcome metric): tracks how long assets run between breakdowns. Should trend upward over time if the PM program is effective.
When compliance is high and emergency work stays below 10%, the program is delivering real results. When compliance is high and emergency work exceeds 20%, the scheduled work needs a hard review.
Tracking compliance alongside emergency work order percentage turns a process metric into a diagnostic tool.
Plants that pair these metrics effectively often find they can reduce reactive maintenance by 30% to 50% within 18 months, simply by redirecting PM content toward the failure modes that actually drive breakdowns.
Making the Shift
Reframing schedule compliance vs equipment reliability means changing the conversation from “did we hit our compliance target” to “is our equipment getting more reliable” requires leadership buy-in and a willingness to ask uncomfortable questions about existing PM programs.
Start with a PM optimization review on the top 20 worst-performing assets (highest failure frequency, highest downtime impact). Compare the current PM tasks to the actual failure history. In most plants, this review reveals that 30% to 50% of PM content has no connection to the failure modes driving breakdowns.
Document what you find. When a PM procedure calls for quarterly greasing on a pump that actually fails due to seal degradation, that’s a concrete example leadership can understand. Build a short list of the most obvious mismatches and present them alongside the failure costs. The business case practically writes itself.
This also means revisiting how PM procedures get written in the first place. Procedures created by copying OEM manuals or borrowing templates from other facilities rarely account for local operating conditions, process chemistry, or environmental factors. A PM tailored to the actual application outperforms a generic one every time.
Replace generic time-based tasks with condition-based inspections where the technology supports it. Route-based vibration analysis, infrared thermography, ultrasonic leak detection, and oil analysis all provide objective evidence of equipment condition that a visual inspection and a grease gun can’t match.
The goal is closing the gap between schedule compliance vs equipment reliability so both tell the same story. When they do, the numbers stop lying, and the maintenance department can prove its value with data that actually matters.


