
TL;DR: MTBF (Mean Time Between Failures) is the average time a repairable asset operates between failures, calculated as Total Operating Time divided by Number of Failures. MTTR (Mean Time To Repair) is the average active repair time per failure, calculated as Total Repair Time divided by Number of Failures. The two metrics combine to produce availability: Availability = MTBF / (MTBF + MTTR). The formulas are simple, but the calculations get misused frequently – confusing MTBF with MTTF, confusing MTTR with MDT, applying constant-failure-rate assumptions to wear-out equipment, and treating vendor MTBF marketing claims as field performance predictions. This guide walks through the formulas, three worked examples at increasing complexity, the most common mistakes, the relationship to availability and Weibull analysis, and the honest limitations of MTBF as a reliability metric.
The Short Answer
MTBF tells you how long your equipment runs between failures on average. MTTR tells you how long it takes to fix when it does fail. Together they tell you availability – the percentage of time the equipment is actually running when you need it.
The formulas are straightforward:
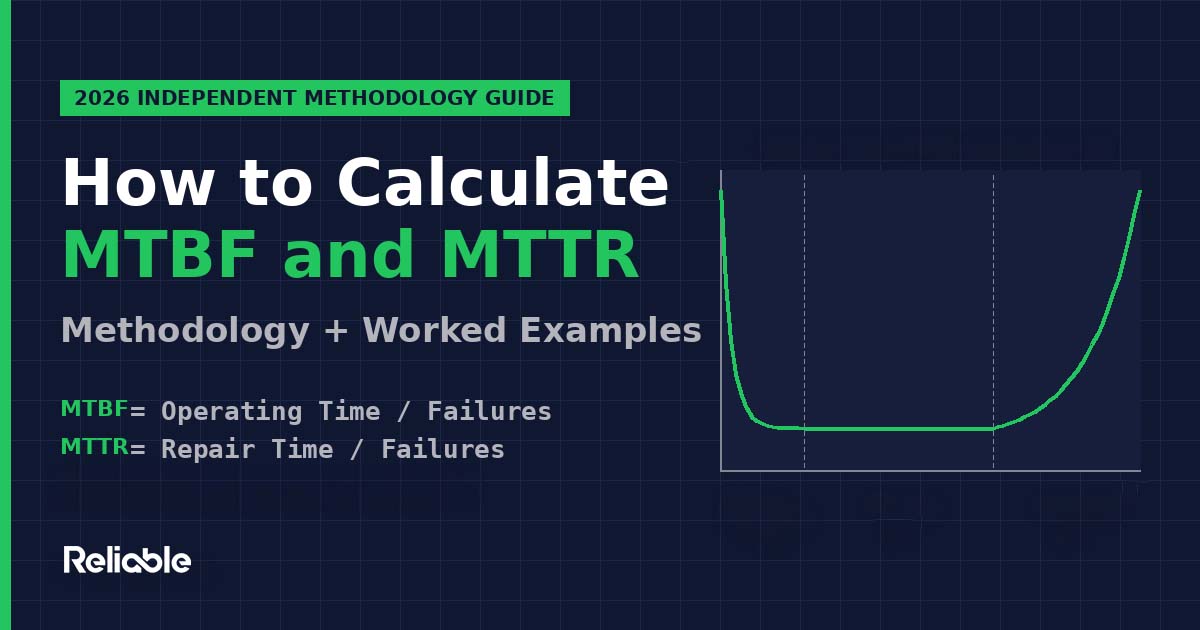
MTBF = Total Operating Time ÷ Number of Failures
MTTR = Total Repair Time ÷ Number of Failures
Availability = MTBF ÷ (MTBF + MTTR)
That’s it for the math. The complexity is in the inputs – what counts as a failure, what counts as operating time, whether MTBF is even the right metric for your equipment, and what the resulting numbers actually mean. The rest of this guide walks through those questions with worked examples and the common mistakes that produce misleading results.
What MTBF and MTTR Actually Measure
Before the formulas matter, the definitions matter. Both metrics are widely misused because the underlying terms get confused with adjacent metrics that look similar but mean different things.
MTBF (Mean Time Between Failures) measures the average time between failure events for a repairable asset. The metric assumes the asset is restored to operating condition after each failure and continues running. MTBF only applies to repairable systems – pumps, motors, production lines, vehicles, electronic systems with field-replaceable components.
MTTR (Mean Time To Repair) measures the average active repair time per failure event. The metric specifically measures the time technicians are actively working on the failure, not the total downtime period. MTTR is what your maintenance team can directly improve through better procedures, parts availability, and technician training.
Both metrics produce results in hours by convention, though some industries use different units (cycles for stamping operations, miles for fleet vehicles, MWh for power generation).
The MTBF Formula in Detail
The MTBF formula is simple, but the inputs require care:
MTBF = Total Operating Time ÷ Number of Failures
Total Operating Time is the time the asset was actually running during the measurement period – not the calendar time, not the scheduled time. If a pump was scheduled to run 720 hours during a 30-day month but was offline for 60 hours due to failures, total operating time is 660 hours. The downtime is excluded from the operating time calculation because the asset was not subject to failure during downtime.
Number of Failures is the count of failure events during the measurement period. The definition of “failure” matters significantly. Most operations count any unplanned stoppage that requires maintenance intervention. Some operations only count failures that exceed a duration threshold (typically 5 to 15 minutes). The methodology matters less than consistency – calculating MTBF with one failure definition this month and a different one next month produces meaningless trends.
The MTTR Formula in Detail
MTTR = Total Repair Time ÷ Number of Failures
Total Repair Time is the sum of active repair hours across all failures during the measurement period. Active repair time starts when the technician begins diagnostic and repair work and ends when the asset is restored to operating condition. Active repair time excludes wait time for parts, wait time for technician arrival, wait time for approval, and post-repair testing time – those are captured in MDT (Mean Down Time), which is a different metric.
This distinction is operationally important. MTTR measures how efficiently your maintenance team executes repairs once they start working. MDT measures the full operational impact of the failure including all delays. Operations that report “MTTR” but actually measure MDT produce numbers that look bad relative to peers because MDT is structurally larger than MTTR.
Worked Example 1: Simple Case
A centrifugal pump operates in a chemical plant. During Q1 2026, the pump experiences three failures. The maintenance team tracks the following data:
- Operating period (Q1, 13 weeks): 2,160 hours scheduled operation
- Failure 1: 2.5 hours active repair
- Failure 2: 4.0 hours active repair
- Failure 3: 3.5 hours active repair
- Total downtime (including all delays): 18 hours
MTBF Calculation:
Total Operating Time = 2,160 – 18 = 2,142 hours
Number of Failures = 3
MTBF = 2,142 ÷ 3 = 714 hours
MTTR Calculation:
Total Repair Time = 2.5 + 4.0 + 3.5 = 10.0 hours
Number of Failures = 3
MTTR = 10.0 ÷ 3 = 3.33 hours
Availability Calculation:
Availability = 714 ÷ (714 + 3.33) = 714 ÷ 717.33 = 99.5%
The pump runs about 714 hours between failures (about 30 days), takes about 3.3 hours to actively repair when it fails, and is available 99.5% of the time when calculated using inherent availability. This is the cleanest version of the calculation – single asset, clean failure boundaries, complete data.
Worked Example 2: Realistic Messy Data
Same pump, but the data is more representative of actual operational conditions. The maintenance team’s records for Q2 2026 show:
- Operating period (Q2, 13 weeks): 2,184 hours scheduled operation
- Failure 1: 1.5 hours active repair, but the pump waited 6 hours for the repair team to arrive (off-shift weekend failure)
- Failure 2: 8 hours active repair, but parts had to be shipped overnight, adding 14 hours of wait time
- Failure 3: 3 hours active repair
- One additional 12-minute stoppage that the operator cleared without maintenance involvement (debated whether this counts as a failure)
- Planned PM during the period: 4 hours (not a failure, excluded from calculations)
The decisions matter:
Decision 1: Does the 12-minute operator-cleared stoppage count as a failure? Per the operation’s policy (failures are stoppages requiring maintenance intervention), it does not count. Number of failures stays at 3.
Decision 2: Wait time is excluded from MTTR but included in MDT. Active repair time totals 1.5 + 8 + 3 = 12.5 hours. Total downtime including wait time totals (1.5 + 6) + (8 + 14) + 3 = 32.5 hours.
Decision 3: Planned PM is excluded from operating time and from failure counts. The 4 hours of PM downtime reduces operating time but doesn’t add to failure count.
MTBF Calculation:
Total Operating Time = 2,184 – 32.5 – 4 = 2,147.5 hours
Number of Failures = 3
MTBF = 2,147.5 ÷ 3 = 715.8 hours
MTTR Calculation (active repair only):
Total Repair Time = 12.5 hours
MTTR = 12.5 ÷ 3 = 4.17 hours
MDT Calculation (total downtime):
Total Downtime = 32.5 hours
MDT = 32.5 ÷ 3 = 10.83 hours
Availability — Inherent (using MTTR):
Availability = 715.8 ÷ (715.8 + 4.17) = 99.4%
Availability — Operational (using MDT):
Availability = 715.8 ÷ (715.8 + 10.83) = 98.5%
Notice the difference: the inherent availability number (99.4%) looks great, but the operational availability number (98.5%) is what actually reflects the pump’s behavior in Q2. The difference is almost a full percentage point of availability – meaningful when calculating production loss or capacity planning.
Worked Example 3: Common Mistake Walkthrough
This example shows what happens when MTBF is calculated incorrectly. A common mistake is using calendar time instead of operating time in the MTBF formula.
A production line operates two shifts per day, five days per week. During Q3 2026, the line experiences five failures with a total of 15 hours of repair time. Calendar time for the quarter is 13 weeks × 7 days × 24 hours = 2,184 hours. Scheduled operating time is 13 weeks × 5 days × 16 hours = 1,040 hours.
The Mistake:
MTBF (incorrect) = 2,184 ÷ 5 = 436.8 hours
This calculation uses calendar time, which includes weekends, evenings, and other non-operating periods when the line could not have failed. The result overestimates MTBF because it gives the line credit for hours it wasn’t running.
The Correct Calculation:
Total Operating Time = 1,040 – 15 = 1,025 hours
MTBF (correct) = 1,025 ÷ 5 = 205 hours
The correct MTBF (205 hours) is less than half the incorrect MTBF (437 hours). The difference matters operationally because reliability decisions, maintenance scheduling, and replacement planning all depend on accurate MTBF. Using calendar time inflates MTBF and makes the equipment look more reliable than it actually is.
This mistake is extremely common in CMMS-generated reliability reports because the default report templates often use calendar time without flagging the assumption. Reliability engineers should validate that their CMMS reports calculate MTBF from operating time rather than calendar time before trusting the numbers.
MTBF vs MTTF vs MTBR: The Distinction Matters
Three similar acronyms get confused frequently, and the differences matter for which formula to use:
MTBF (Mean Time Between Failures) applies to repairable systems. The asset fails, gets repaired, and continues operating. MTBF measures the average operating time between failure events. Use MTBF for pumps, motors, production lines, vehicles, and any equipment that gets repaired rather than replaced.
MTTF (Mean Time To Failure) applies to non-repairable systems. The item fails and gets replaced rather than repaired. MTTF measures the average operating time until first failure. Use MTTF for light bulbs, single-use sensors, disposable filters, and any item that gets discarded after failure.
MTBR (Mean Time Between Repairs) is similar to MTBF but counts all maintenance work, including planned PMs, not just failures. MTBR is less common but appears in some reliability literature. The distinction from MTBF matters when planned maintenance frequency is itself an operational variable being optimized.
Using the wrong metric for your equipment type produces misleading results. Vendor data sheets sometimes report MTBF for components that should report MTTF (because they’re not field-repairable), which inflates the apparent reliability of replaceable components.
MTTR vs MDT: The Distinction Matters Too
MTTR and MDT are frequently confused, and the difference is operationally significant.
MTTR (Mean Time To Repair) measures active repair time only. From the moment a technician begins diagnostic work to the moment the asset is restored to operating condition. MTTR captures how efficiently your maintenance team executes repairs.
MDT (Mean Down Time) measures total downtime. From the moment the failure occurs to the moment the asset is restored to operating condition, including:
- Detection time (how long until the failure is noticed)
- Wait time for technician arrival
- Diagnostic time
- Wait time for parts
- Wait time for approvals or work orders
- Active repair time
- Post-repair testing
- Restart time
MDT is almost always longer than MTTR. The gap between them measures process inefficiency – slow detection, slow response, parts unavailability, approval delays. Operations that focus on improving MTTR are optimizing repair execution. Operations that focus on improving MDT are optimizing the entire response process. Both matter, but they require different management interventions.
The distinction matters when reporting availability. Inherent availability uses MTTR and assumes the only downtime contributors are failure and active repair. Operational availability uses MDT and reflects total operational impact. Most published availability numbers use the inherent formula because it produces cleaner math and better-looking numbers, but the operational availability formula is more useful for actual maintenance decision-making.
The Relationship Between MTBF, MTTR, and Availability
The formula that ties everything together:
Inherent Availability = MTBF ÷ (MTBF + MTTR)
Operational Availability = MTBF ÷ (MTBF + MDT)
The formula reveals two paths to higher availability: increase MTBF (failures occur less often) or decrease MTTR/MDT (failures get resolved faster when they occur). Both matter, but the leverage differs depending on starting position.
For equipment with very high MTBF and moderate MTTR, additional MTBF improvements have diminishing returns on availability. The pump in Worked Example 1 has 99.5% availability – improving MTBF further produces marginal gains, while reducing MTTR delivers more meaningful improvement. For equipment with low MTBF and high MTTR, both metrics need attention because either one alone won’t produce acceptable availability.
Reliability engineers use this relationship to prioritize improvement efforts. Plotting MTBF and MTTR on a 2×2 matrix and identifying which equipment falls into which quadrant tells you whether to invest in failure prevention, repair speed, or both.
The Honest Critique: What MTBF Doesn’t Tell You
MTBF is widely used and widely misused. A few honest assessments worth flagging.
MTBF assumes a constant failure rate. The standard MTBF calculation assumes failures occur randomly through time at a constant rate — the random failure portion of the bathtub curve. This assumption breaks down for equipment in infant mortality (early-life failures from defects or installation errors) or wear-out (end-of-life failures from accumulated damage). Equipment in either of these regions doesn’t have a meaningful constant MTBF, and the calculated number can be misleading.
For equipment outside the constant failure rate region, Weibull analysis provides more accurate reliability modeling. The shape parameter (beta) in Weibull analysis indicates which failure mode is dominant: beta less than 1 indicates infant mortality, beta equal to 1 indicates random failure (where MTBF applies cleanly), and beta greater than 1 indicates wear-out. Reliability engineers serious about asset management eventually outgrow MTBF and migrate to Weibull-based reliability modeling.
MTBF marketing claims are often misleading. Vendors frequently quote MTBF figures of hundreds of thousands or millions of hours for components that have never been tested anywhere near that long. A claimed MTBF of 1,000,000 hours represents 114 years of continuous operation. These numbers come from accelerated life testing, statistical extrapolation from small sample sizes, or theoretical reliability modeling – not actual operational data. Reliability engineers should treat marketing MTBF claims as reference data points rather than predictions of actual field performance.
MTBF says nothing about failure consequences. Two pieces of equipment with identical MTBF can have radically different operational impact. A pump with 700-hour MTBF and predictable, contained failures is operationally different from a pump with 700-hour MTBF and catastrophic failures that take down the whole production line. MTBF is a useful metric but it’s incomplete – pairing it with failure mode analysis (FMEA) and consequence assessment produces more useful reliability intelligence.
MTBF can be gamed. Operations that focus heavily on MTBF as a KPI sometimes adjust their failure definitions to improve the number rather than improve actual reliability. Counting fewer events as “failures” (raising the duration threshold, classifying events as planned maintenance, attributing failures to operator error rather than equipment failure) produces higher MTBF without improving anything operationally. Reliability KPIs work best when paired with definitions that don’t shift over time.
Industry Context: How MTBF and MTTR Vary Across Industries
MTBF and MTTR benchmarks vary substantially across industries, and direct comparisons are often misleading.
Process manufacturing – chemicals, refining, pulp and paper – typically reports MTBF in tens of thousands of hours for major equipment because the operations are continuous and equipment has long planned lives. A reciprocating compressor with 50,000-hour MTBF is operationally normal in process operations.
Discrete manufacturing – automotive, electronics, packaging – typically reports MTBF in hundreds to low thousands of hours for production line equipment because the duty cycles are more variable and equipment configurations change with product mix. A stamping press with 2,000-hour MTBF is operationally reasonable in discrete manufacturing.
Power generation reports MTBF for turbines, generators, and balance-of-plant equipment in tens of thousands of hours, with major equipment expected to run 50,000+ hours between major overhauls. Combined-cycle gas turbines typically run 24,000 to 32,000 fired hours between major inspections.
Oil and gas reports MTBF for rotating equipment (pumps, compressors, turbines) in tens of thousands of hours, with critical service equipment often running 60,000+ hours between major overhauls. The economic consequences of failure drive emphasis on long MTBF.
Aerospace and defense uses MTBF heavily for electronic systems and components, with reliability requirements often expressed as minimum MTBF specifications. The constant-failure-rate assumption is more reasonable for electronic systems than for mechanical equipment, which is why MTBF is more widely accepted in aerospace than in mechanical industries.
Fleet operations often track MTBF in miles or operating hours rather than calendar time. Heavy-duty trucks typically report MTBF in tens of thousands of miles. Rail equipment reports MTBF in operating hours for locomotives and miles for rolling stock.
The benchmarks listed are operational ranges rather than universal targets. Useful reliability comparison requires similar equipment in similar service conditions with consistent failure definitions. Cross-industry MTBF comparisons typically produce misleading conclusions because the underlying calculations and failure definitions vary too much.
Common Mistakes in MTBF and MTTR Calculations
The formulas are simple. The mistakes are everywhere. Six common errors that produce misleading numbers:
1. Using calendar time instead of operating time. Most common mistake in CMMS-generated reliability reports. Inflates MTBF by giving the equipment credit for hours it wasn’t running. Always validate that operating time excludes scheduled non-operating periods.
2. Confusing MTBF with MTTF. MTBF is for repairable systems, MTTF is for non-repairable items. Using MTBF for non-repairable components (or vice versa) misrepresents reliability and produces numbers that don’t behave the way the formula assumes.
3. Confusing MTTR with MDT. MTTR is active repair time only. MDT is total downtime including all delays. Reporting MDT but calling it MTTR makes maintenance teams look slower than they actually are. Reporting MTTR but using it where MDT belongs makes availability look better than reality.
4. Inconsistent failure definitions. Counting events differently month to month produces meaningless trends. Establish a consistent failure definition (typically: any unplanned stoppage requiring maintenance intervention) and apply it consistently.
5. Including planned maintenance in failure counts. Planned PMs and scheduled overhauls are not failures. Including them in failure counts depresses MTBF artificially. Operating time should be reduced by planned maintenance hours, but failure count should not be increased.
6. Applying constant-failure-rate assumptions to wear-out equipment. Equipment in wear-out failure mode (beta > 1 in Weibull terms) doesn’t have a meaningful constant MTBF. Using MTBF for wear-out equipment systematically underestimates failure probability as the equipment ages. Weibull analysis is the correct approach for wear-out equipment.
Frequently Asked Questions
What is the formula for MTBF?
MTBF = Total Operating Time / Number of Failures. Total operating time is the time the asset was actually running during the period, not the total elapsed time. The result is expressed in hours and represents the average time between failures during the measurement period. MTBF only applies to repairable systems – for non-repairable items, the corresponding metric is MTTF.
What is the formula for MTTR?
MTTR = Total Repair Time / Number of Failures. Total repair time is the sum of active repair hours across all failures during the period. The result is expressed in hours and represents the average active repair time per failure event. MTTR specifically measures active repair work, not total downtime – total downtime including wait time is measured by MDT (Mean Down Time), which is typically longer than MTTR.
What is the difference between MTBF and MTTF?
MTBF (Mean Time Between Failures) applies to repairable systems – equipment that can be restored to operating condition through maintenance. MTTF (Mean Time To Failure) applies to non-repairable items – components that are replaced rather than repaired. The terms are frequently confused, and using MTBF when you should use MTTF (or vice versa) is one of the most common mistakes in reliability calculations.
What is the difference between MTTR and MDT?
MTTR (Mean Time To Repair) measures active repair time only. MDT (Mean Down Time) measures total downtime including wait time for parts, technician arrival, and approvals. MDT is almost always longer than MTTR, sometimes substantially. Reliability calculations that confuse the two produce misleading availability numbers.
How do you calculate availability from MTBF and MTTR?
Inherent availability is calculated as: Availability = MTBF / (MTBF + MTTR). Operational availability uses MDT instead of MTTR: Availability = MTBF / (MTBF + MDT). The inherent formula produces cleaner math; the operational formula is more useful for actual maintenance decision-making.
What is a good MTBF for industrial equipment?
MTBF benchmarks vary dramatically by equipment type and industry. Centrifugal pumps typically run 30,000 to 90,000 hours MTBF in well-maintained operations. Industrial gearboxes typically run 50,000 to 200,000 hours. Process control valves typically run 10,000 to 50,000 hours. Electric motors in clean industrial environments typically run 50,000 to 100,000 hours. The ‘good MTBF’ question is generally less useful than benchmarking against similar operations and tracking MTBF trend over time.
Why are MTBF marketing claims often misleading?
Vendors frequently quote MTBF figures of hundreds of thousands or millions of hours for components that have never been tested anywhere near that long. These numbers come from accelerated life testing or statistical extrapolation, not actual operational data. A claimed MTBF of 1,000,000 hours represents 114 years of continuous operation. Reliability engineers should treat marketing MTBF claims as reference data points rather than predictions of actual field performance.
Does MTBF assume a constant failure rate?
Yes, traditional MTBF calculations assume a constant failure rate. This assumption breaks down for equipment in infant mortality or wear-out. For equipment outside the constant failure rate region, Weibull analysis provides more accurate reliability modeling. The shape parameter (beta) in Weibull analysis indicates which failure mode is dominant.
Related Guides
- How to Calculate OEE: Methodology and Worked Examples
- How to Perform FMEA
- Best CMMS Software 2026: Independent Comparison
- Best Asset Performance Management Software 2026
- APM vs CMMS: What’s the Difference, and Which One Do You Need?
Sources
- SMRP Best Practices – Society for Maintenance and Reliability Professionals
- SMRP Metrics – SMRP standardized maintenance and reliability metrics
- ISO 14224 – Petroleum, petrochemical and natural gas industries: collection and exchange of reliability and maintenance data
- MIL-HDBK-217F – Reliability Prediction of Electronic Equipment
- IEC 60050-191 – International Electrotechnical Vocabulary, Dependability and quality of service
- “Maintenance Best Practices” by Ramesh Gulati
- “Rules of Thumb for Maintenance and Reliability Engineers” by Ricky Smith and R. Keith Mobley
- “An Introduction to Reliability and Maintainability Engineering” by Charles E. Ebeling
- Reliable Magazine independent editorial analysis
Last updated: May 2, 2026. This guide is editorial analysis by Reliable Magazine.