
TL;DR: Overall Equipment Effectiveness (OEE) equals Availability times Performance times Quality. Availability is run time divided by planned production time. Performance is ideal cycle time times total count divided by run time. Quality is good count divided by total count. World-class OEE is typically 85% or higher in discrete manufacturing, with average OEE around 60%. The formula is simple – the hard part is using OEE without misleading yourself. This guide walks through the calculation with three worked examples, addresses common mistakes, and discusses OEE’s real limitations.
How We Approach This Guide
This is independent editorial analysis from Reliable Magazine. We do not sell OEE software, manufacturing execution systems, or consulting services. Our goal is to help maintenance and reliability professionals – and the operations leaders who depend on their work – calculate OEE correctly and use it productively.
What OEE Actually Measures
Overall Equipment Effectiveness measures how effectively a piece of equipment is being used during planned production time. It rolls three separate measurements — how often the equipment runs, how fast it runs, and how much good output it produces – into a single percentage. An OEE score of 100% would mean the equipment ran every minute it was scheduled to run, at theoretical maximum speed, producing zero defects. No real operation achieves 100%. World-class operations achieve 85%. Average operations are around 60%. Many operations that think they are doing well are actually around 40-50% once OEE is calculated honestly.
The reason OEE matters is that it forces operations to confront three losses simultaneously. Most production tracking focuses on one dimension — output, throughput, or yield — and lets the others hide. OEE makes the trade-offs visible. A line that runs 95% of the time at 60% of speed has the same nominal output as a line that runs 60% of the time at 95% of speed, but the underlying problems and improvement paths are completely different. OEE separates the two.
The OEE Formula
OEE is the product of three factors:
OEE = Availability × Performance × Quality
Each factor is calculated separately, expressed as a decimal between 0 and 1, and multiplied together. The result is converted back to a percentage. Each factor measures a different category of production loss, which is why all three matter.
Availability
Availability = Run Time ÷ Planned Production Time
Availability measures the percentage of planned production time during which the equipment was actually running. Planned Production Time is the time the equipment was scheduled to produce, after subtracting time when production was not scheduled (shifts not running, scheduled major maintenance). Run Time is Planned Production Time minus all stop time, including breakdowns, changeovers, minor stops, and material starvation.
The category of losses Availability captures is sometimes called downtime losses – anything that prevents the equipment from running when it was scheduled to run.
Performance
Performance = (Ideal Cycle Time × Total Count) ÷ Run Time
Performance measures how close the equipment ran to its theoretical maximum speed. Ideal Cycle Time is the theoretical fastest possible time to produce one unit – based on equipment design, not nameplate ratings or historical bests. Total Count is all units produced during Run Time, both good and defective. The numerator is what production should have taken at ideal cycle time. The denominator is the actual run time. The ratio expresses how close to ideal the equipment ran.
The category of losses Performance captures is called speed losses – anything that caused the equipment to run slower than its theoretical maximum, including minor stops too short to count as breakdowns, slow cycles, and idling.
Quality
Quality = Good Count ÷ Total Count
Quality measures the fraction of production that met quality requirements without rework. Good Count is units that passed quality inspection on the first attempt. Total Count is all units produced including defects, scrap, and units requiring rework. Reworked units count as defective for OEE purposes — even if they eventually become good product, the rework consumed production capacity and represents a quality loss.
The category of losses Quality captures is called quality losses – defects, scrap, rework, and yield losses.
Combining the Three
Once you have the three factors, multiply them together. If Availability is 0.90, Performance is 0.95, and Quality is 0.99, OEE is 0.90 × 0.95 × 0.99 = 0.847, or 84.7%.
The multiplication matters. A common mistake is to look at three healthy-looking individual factors and assume the overall OEE is similarly healthy. But losses compound. Three factors at 90% each – which sounds good – produce an OEE of 72.9%. To achieve 85% OEE, each factor needs to average roughly 95%. The three factors all need to be strong simultaneously, which is harder than improving any single one.
Worked Example: Clean Numbers
A production line is scheduled to run a single eight-hour shift. The shift includes a 30-minute lunch break and two 15-minute breaks (60 minutes total) that are not counted as planned production time.
- Shift length: 480 minutes
- Breaks (not planned production time): 60 minutes
- Planned Production Time: 420 minutes
- Stop time (breakdowns and changeovers): 60 minutes
- Run Time: 360 minutes
- Ideal Cycle Time: 1.0 minutes per unit
- Total Count: 320 units
- Good Count: 304 units
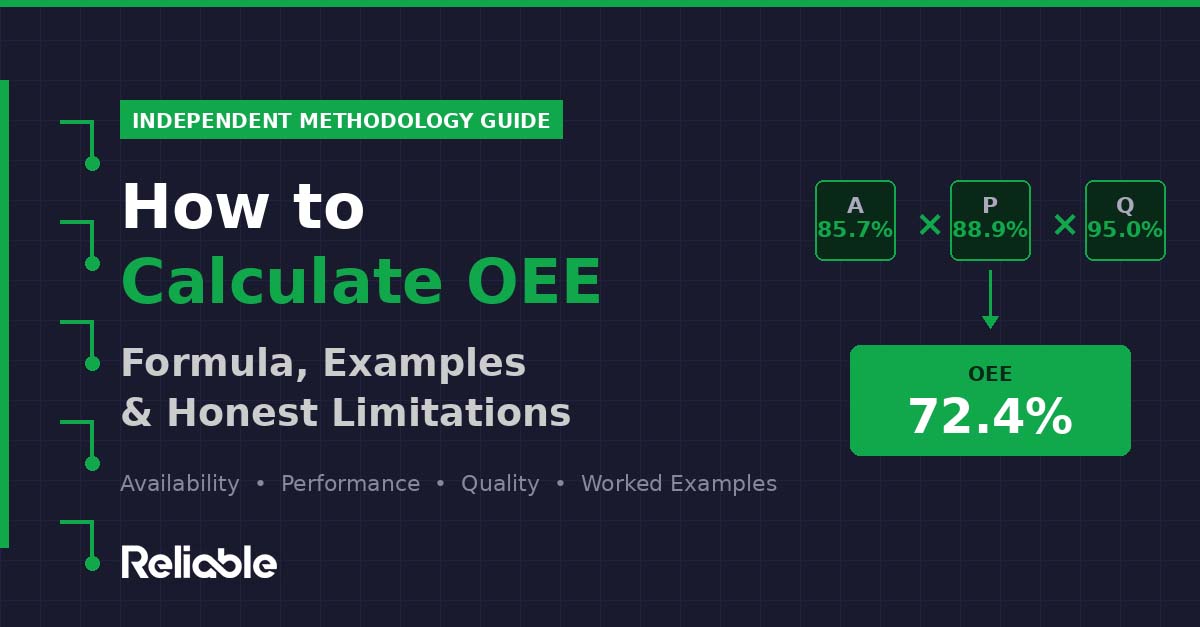
Availability = 360 ÷ 420 = 0.857 (85.7%)
Performance = (1.0 × 320) ÷ 360 = 0.889 (88.9%)
Quality = 304 ÷ 320 = 0.950 (95.0%)
OEE = 0.857 × 0.889 × 0.950 = 0.724 (72.4%)
This line is running at 72.4% OEE – above average, but well below world-class. The largest opportunity is in Performance (88.9%), which suggests minor stops and speed losses. The next-largest opportunity is in Availability (85.7%), suggesting downtime improvements would help. Quality (95.0%) is the strongest factor and probably not the right area to focus on first.
Worked Example: Realistic Messy Data
A packaging line runs 24 hours per day across three shifts. Across a one-week production period:
- Total scheduled time: 168 hours (10,080 minutes)
- Scheduled maintenance: 8 hours (one shift)
- Operator breaks and meetings: 12 hours across the week
- Planned Production Time: 148 hours (8,880 minutes)
- Breakdown time: 14 hours (840 minutes)
- Changeover time: 6 hours (360 minutes)
- Material starvation: 3 hours (180 minutes)
- Total stop time: 23 hours (1,380 minutes)
- Run Time: 125 hours (7,500 minutes)
- Ideal Cycle Time: 0.5 minutes per case
- Total Count: 13,200 cases
- Good Count: 12,540 cases (defective: 660 cases or 5%)
Availability = 7,500 ÷ 8,880 = 0.845 (84.5%)
Performance = (0.5 × 13,200) ÷ 7,500 = 0.880 (88.0%)
Quality = 12,540 ÷ 13,200 = 0.950 (95.0%)
OEE = 0.845 × 0.880 × 0.950 = 0.706 (70.6%)
This line is running at 70.6% OEE. The improvement priorities are clear: Performance is the biggest opportunity at 88.0%, suggesting minor stops and speed losses are the dominant problem. Within Availability, the largest single category is breakdowns (14 hours of 23 hours of stop time), suggesting reliability improvement would have the biggest impact on uptime.
Worked Example: A Common Mistake
Same packaging line as above, but the production team wants to make the OEE number look better. They reclassify changeover time and operator breaks as planned downtime rather than counting them in Availability:
- Planned Production Time (after reclassifying): 142 hours instead of 148 hours
- Stop time (after reclassifying): 17 hours instead of 23 hours
- Run Time: 125 hours (unchanged)
Availability = 7,500 ÷ 8,520 = 0.880 (88.0%) – up from 84.5%
Performance and Quality unchanged at 88.0% and 95.0%.
OEE = 0.880 × 0.880 × 0.950 = 0.736 (73.6%)
The OEE score went from 70.6% to 73.6% – the equipment did not change, the operations did not improve, only the classification changed. This is one of the most common ways OEE numbers are inflated, and it produces a score that looks better while masking the same underlying losses. If you find yourself or your team debating which losses count as planned downtime versus availability losses, you are probably classifying too much as planned downtime. The default should be that production losses count against OEE unless they are genuinely outside operational control.
Calculating OEE for Your Operation
To calculate OEE for your own production data, you need five inputs:
- Planned Production Time (in minutes) – total scheduled production time, excluding unscheduled time and breaks that are not counted as planned production
- Stop Time (in minutes) – all time not running during planned production, including breakdowns, changeovers, and minor stops
- Ideal Cycle Time (minutes per unit) – theoretical fastest time to produce one unit
- Total Count (units) – all units produced during run time, including defects
- Good Count (units) – units that met quality requirements without rework
From these five inputs, work through the four calculations:
- Run Time = Planned Production Time minus Stop Time
- Availability = Run Time divided by Planned Production Time
- Performance = (Ideal Cycle Time times Total Count) divided by Run Time
- Quality = Good Count divided by Total Count
Then multiply the three factors together: OEE = Availability × Performance × Quality.
Most spreadsheet applications can run this calculation in a few cells. Most CMMS, EAM, and MES platforms can calculate OEE automatically once configured with the right data inputs – see our MES platforms guide for platforms that handle this natively.
What Is a Good OEE Score?
The most-quoted OEE benchmarks come from research and industry surveys, with general consensus around three tiers:
- World-class: 85% OEE or higher, with each factor approximately 90% or higher. Achieved by a small fraction of operations.
- Acceptable: 60% OEE – often cited as the typical OEE in discrete manufacturing, though significant variation exists by industry.
- Low: 40% OEE or lower, indicating substantial improvement opportunity. More common than most operations realize, particularly when OEE is calculated honestly.
These benchmarks come from the original work by Seiichi Nakajima, who introduced OEE through his TPM framework in the 1980s, and have been refined through decades of industry practice. The numbers should be treated as general guidance rather than precise targets — the right OEE for your operation depends on equipment age, production complexity, industry, and product mix.
OEE in Different Industries
The standard OEE benchmarks come from discrete manufacturing – making distinct units like packaged goods, electronics, or automotive components. Other industries calculate and benchmark OEE differently:
Process industries (chemicals, pharmaceutical bulk manufacturing, food and beverage processing) commonly run higher OEE than discrete manufacturing because production is more continuous, changeovers are less frequent, and equipment is designed for continuous operation. World-class targets in process industries can reach 90%+ OEE, with the dominant losses being downtime rather than speed or quality.
High-mix discrete manufacturing (electronics with frequent product changes, contract manufacturing, semiconductor) often runs lower OEE than mass production discrete because changeover losses are larger as a percentage of total time. World-class targets in high-mix environments may be 70-80% rather than 85%.
Process industries with batch production (specialty chemicals, pharmaceutical batch manufacturing) calculate OEE differently because production is intentionally non-continuous. Some operations use Process OEE which includes batch setup and tear-down, while others measure equipment effectiveness only during active production phases.
The honest answer is that comparing OEE numbers across different industries or different production models is misleading. OEE is most useful for tracking improvement within a specific operation over time, not for benchmarking across operations.
The Honest Limitations of OEE
OEE is widely used and widely misused. The number that rolls up to executive dashboards often masks more than it reveals. Several limitations are worth understanding before you use OEE as a primary management metric.
OEE can be gamed. The most common form of OEE gaming is reclassifying production losses as planned downtime, as illustrated in the worked example above. Other forms include using nameplate cycle time instead of true ideal cycle time (overstating Performance), counting reworked units as good production (overstating Quality), and aggregating OEE across dissimilar equipment in ways that hide poor performance behind good performance. Operations that report rapidly rising OEE without corresponding rises in actual production output are usually gaming the metric rather than improving the operation.
OEE doesn’t measure what matters most in some operations. Equipment effectiveness is one input to operational success, not the goal itself. Maximizing OEE on a constrained production line can drive improvement. Maximizing OEE on a non-constrained line wastes effort that should go to the bottleneck. OEE on a non-bottleneck operation can hit 95% while the overall plant misses production targets – the metric reports success while the business reports failure.
OEE encourages overproduction. If a line’s OEE is measured by output during running time, the easy way to boost OEE is to keep running even when downstream demand has stopped. This produces inventory rather than sales, hides demand signals, and creates the kind of unsynchronized production that lean manufacturing was specifically designed to eliminate. OEE used without lean discipline can drive exactly the wrong behavior.
OEE alone doesn’t tell you what to fix. An OEE of 70% does not tell you whether to invest in reliability improvement, faster changeovers, quality improvements, or operator training. The three component factors give some direction, but real improvement work requires deeper analysis – Pareto analysis of downtime causes, root cause investigation of recurring failures, and understanding of which losses are economically worth fixing. OEE is a starting point for analysis, not the analysis itself.
Used carefully, OEE is one of the most useful operational metrics available. Used uncritically, it can mislead operations into pursuing the wrong improvements or into believing they are improving when they are not. The metric is genuinely valuable. The discipline around how it is calculated and used is what determines whether it produces real operational improvement.
Common Mistakes in OEE Calculation
The five most common errors in OEE calculation, in approximate order of frequency:
1. Using nameplate cycle time instead of ideal cycle time. Equipment manufacturers publish nameplate cycle times that often include conservative margins. Ideal cycle time should reflect the genuine theoretical maximum — what the equipment achieves under perfect conditions, not what the manufacturer is willing to commit to in writing. Using nameplate cycle time inflates Performance.
2. Classifying too much downtime as planned. The default should be that production losses count against OEE. Time qualifies as planned downtime only when it is genuinely outside operational control – scheduled major maintenance, contractually mandated breaks, regulatory requirements. Routine changeovers, brief operator breaks, and scheduled meetings should usually count against Availability.
3. Counting reworked units as good production. Quality measures first-pass yield. Reworked units consumed production capacity and indicate a quality loss, even if they eventually become good product. Counting them as good production overstates Quality and hides the cost of rework.
4. Inconsistent definitions across shifts or departments. If different shifts classify “minor stops” or “changeover time” differently, OEE comparisons across shifts become meaningless. Establish clear, written definitions for what counts as each type of loss, train all operators on the definitions, and audit the data periodically.
5. Aggregating OEE across dissimilar equipment. Plant-level OEE that averages across very different equipment hides individual performance issues. A 75% plant OEE can include lines running at 95% and lines running at 55%, with completely different improvement priorities. OEE is most useful at the equipment or line level, with aggregation used for context rather than as the primary management view.
Frequently Asked Questions
What is the formula for OEE?
OEE equals Availability times Performance times Quality, with each factor expressed as a decimal. Availability is run time divided by planned production time. Performance is ideal cycle time times total count divided by run time. Quality is good count divided by total count. The three factors are multiplied together to produce the overall OEE score, typically expressed as a percentage.
What is a good OEE score?
World-class OEE is typically considered to be 85% or higher in discrete manufacturing, with each underlying factor (Availability, Performance, Quality) at approximately 90% or higher. Average OEE in manufacturing is often cited at 60%, though this number varies significantly by industry. Process industries like chemicals and pharmaceutical manufacturing commonly run higher OEE because their production is more continuous, while discrete manufacturing with frequent changeovers often runs lower OEE. The right target depends on industry and production model.
How is OEE different from TEEP?
OEE measures effectiveness during planned production time. TEEP (Total Effective Equipment Performance) measures effectiveness against all available time, including time when production is not scheduled. TEEP equals OEE times Utilization, where Utilization is planned production time divided by all calendar time. TEEP is more useful for capital planning and capacity analysis. OEE is more useful for operational improvement and performance management of running equipment.
Should planned downtime count against OEE?
By the standard definition, planned downtime is excluded from OEE – it reduces planned production time rather than counting against availability. However, this is one of the most misused aspects of OEE. Organizations sometimes classify too much downtime as planned to inflate OEE scores, treating routine changeovers, scheduled meetings, and breaks as planned downtime. The honest approach is to include in planned downtime only events that are genuinely outside the scope of operational improvement, like scheduled major maintenance shutdowns. Routine production losses should be included in OEE.
What are the most common mistakes in calculating OEE?
The most common OEE calculation mistakes include using nameplate cycle time instead of ideal cycle time (overstating Performance), classifying too many production losses as planned downtime to inflate Availability, counting reworked units as good production (overstating Quality), inconsistent definitions of run time and stop time across shifts or departments, and aggregating OEE across dissimilar equipment in ways that mask underlying performance variation. Each of these errors produces OEE scores that look better than reality and obscure improvement opportunities.
Why is my OEE low and what should I do about it?
Low OEE almost always reflects one or two dominant factors rather than uniform underperformance. Calculate Availability, Performance, and Quality separately to identify which factor is driving the low score. Low Availability typically indicates breakdowns, long changeovers, or material starvation. Low Performance typically indicates minor stops, slow cycles, or operator-related variation. Low Quality typically indicates process variation, equipment defects, or training gaps. Improvement efforts should focus on the dominant factor first rather than spreading attention across all three.
Related Resources
- How to Perform FMEA
- How to Calculate MTBF and MTTR
- OEE definition in our Maintenance and Reliability Glossary
- Best CMMS Software 2026: Independent Comparison of 7 Platforms
- Best EAM Software 2026: Independent Comparison of 6 Platforms
Sources
- Nakajima, Seiichi – original TPM framework and OEE methodology, 1988
- SAE JA1011 – Reliability-Centered Maintenance standard
- Industry research from Plant Engineering, Reliability Magazine, and SMRP
- Reliable Magazine independent editorial analysis and practitioner consultation
Last updated: April 28, 2026. This guide is editorial analysis from Reliable Magazine. No vendor paid for inclusion or editorial input.