
Every CMMS in every plant is holding a list of deferred work orders. Some of those work orders are three months old. Some are three years old. Each one represents a piece of equipment that asked for help and was told to wait.
The maintenance backlog is one of the most honest documents in any facility. It doesn’t exaggerate. It doesn’t politic. It simply records what was requested and what wasn’t done. And in most plants, it’s growing.
According to industry benchmarks, a healthy maintenance backlog sits between two and four weeks of work. Anything beyond six weeks signals a system under stress. Many facilities carry backlogs measured in months or years, and they’ve grown so accustomed to it that the number barely registers anymore.
What the Backlog Actually Tells You
A growing backlog functions as a forecast. Every deferred PM, every open corrective work order, every inspection that got pushed to next quarter is a data point predicting future failures.
The pattern is remarkably consistent. A vibration analyst flags elevated readings on a pump. A work order gets created. Maintenance reviews it and schedules the repair for the next available window. Then production needs the line, and the window closes. The work order ages. The pump keeps running. The vibration levels climb.
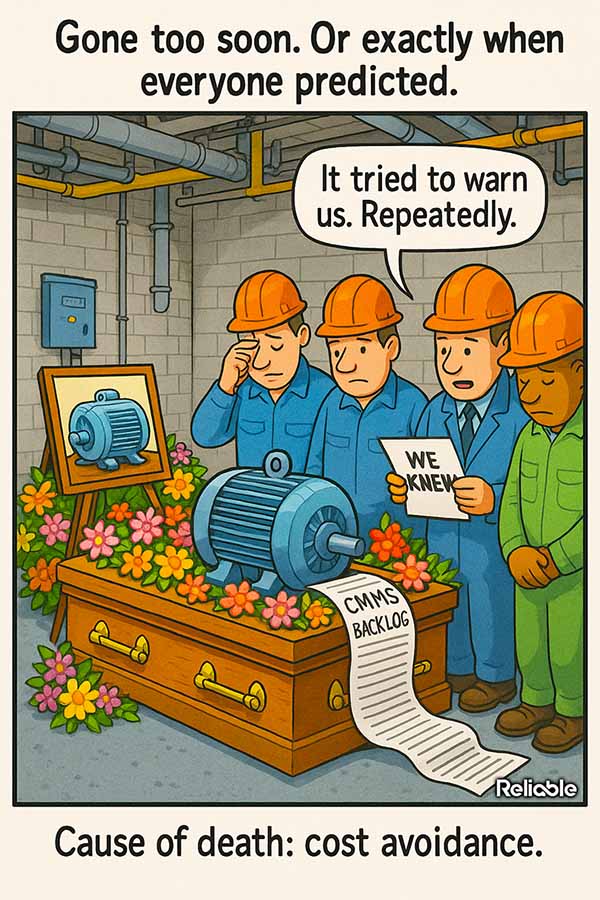
A maintenance backlog is a countdown. Every deferred work order is ticking toward a failure that will cost five to ten times more than the planned repair.
Three months later, the pump seizes. Now it’s an emergency. The repair costs five times what the planned job would have. Production loses a shift. The maintenance team drops everything else, which pushes other planned work into the backlog. The cycle feeds itself.
This is the core paradox of maintenance backlogs: the longer you defer work, the more work you create. Deferred PMs lead to corrective work orders. Deferred corrective work leads to breakdowns. Breakdowns consume the labor hours that should have been spent on the planned work. The backlog grows.
Cost Avoidance vs. Cost Savings
Part of the problem is how maintenance spending gets evaluated. Most organizations track cost savings with precision. If you renegotiate a parts contract and save $50,000, that number shows up in a quarterly report. Someone gets credit for it.
Cost avoidance is harder to quantify. If you replace a coupling during a planned outage and prevent a catastrophic failure that would have cost $200,000, the savings are real but invisible. The failure didn’t happen. There’s no dramatic event. Nobody writes a report about the disaster that was averted.
The work you defer today becomes the emergency you fund tomorrow. Cost avoidance doesn’t show up on a spreadsheet, but the failures it prevents would have.
This creates a perverse incentive structure. The maintenance team that runs lean and prevents failures looks, on paper, like it’s spending money without clear returns. The maintenance team that’s perpetually in crisis mode looks busy, essential, and heroic. The budget rewards the wrong behavior.
Making the Invisible Visible
The fix starts with tracking. If your CMMS can record why work was deferred (and most can), you have the raw material to build a cost avoidance case.
- Track deferred work orders by reason code: budget, labor availability, parts, production schedule. This tells you which constraint is actually driving the backlog.
- Calculate the estimated cost of unplanned failure for your top 20 backlog items. Compare that to the cost of the planned repair. The ratio is usually between 3:1 and 10:1.
- Flag any backlog item older than 90 days on critical or safety-related equipment. These should trigger an automatic review, not just a line on a spreadsheet.
Some organizations have started presenting backlog data as a risk register. Instead of showing management a list of open work orders (which reads as a to-do list), they show a portfolio of unmanaged risks with estimated financial exposure. The conversation changes immediately when the backlog is framed as “we are currently carrying $2.3 million in deferred risk” rather than “we have 347 open work orders.”
The Warning Signs Were Always There
Equipment rarely fails without warning. Most mechanical and electrical failures follow a degradation curve that’s visible to anyone who’s looking. Vibration increases. Temperatures rise. Oil analysis shows elevated wear metals. Ultrasonic readings pick up changes in bearing condition.
The data exists. It’s in your CMMS, your condition monitoring system, your operators’ shift logs. The problem is that data without action is just noise. And when the backlog grows past a certain point, the organization loses its ability to act on the signals.
- Condition monitoring data that triggers a work order which sits in the backlog for six months is worse than useless. It’s expensive noise: you paid for the monitoring but didn’t act on the findings.
- Operator rounds that note the same anomaly week after week without resolution train operators to stop reporting. If nothing happens when they flag a problem, they’ll eventually stop flagging.
- Repeat emergency work orders on the same asset are the clearest signal that planned work was deferred too long. Your CMMS can generate this report. Run it.
The information gap in most plants comes down to response, plain and simple. The systems are generating warnings. The warnings are being recorded. They’re just not being acted on in time.
Rebuilding the Response
Getting a backlog under control doesn’t require a massive capital investment. It requires discipline and prioritization.
Start by triaging. Rank every backlog item by consequence of failure, not by age or department request. A three-year-old work order on a non-critical utility pump might be acceptable. A three-month-old work order on a critical process compressor is a ticking time bomb.
The only question worth asking about an aging work order: what happens if this fails next Tuesday at 2 a.m.?
Next, establish a weekly backlog review. Treat it as a risk review, because that’s what it is. Look at what’s aging, what’s been deferred more than once, and what condition monitoring data has changed since the work order was created. Adjust priority in real time based on equipment condition, not just original assessment.
Then measure and report. Track backlog size in weeks of work, not just count. Report the estimated financial exposure of the deferred work. Present it alongside production risk.
The Cultural Shift
The hardest part is changing the conversation. In many organizations, maintenance is viewed as a cost center, and the backlog is seen as a natural consequence of budget constraints. That framing makes the backlog feel inevitable.
It’s worth reframing. The backlog represents investment that was approved (someone created those work orders for a reason) but not funded. Every item on it was, at some point, deemed necessary by someone with knowledge of the equipment. Deferring it was a conscious choice with consequences.
- Review your top 10 most expensive unplanned failures from the past year. How many had a corresponding planned work order in the backlog before the failure occurred?
- Calculate the total cost of those failures vs. the cost of the deferred planned work. Share that number with leadership.
The plants that manage backlogs well have better visibility into what happens when planned work doesn’t get done. They’ve made the invisible cost visible, and they’ve given leadership enough information to make informed tradeoffs instead of blind ones.
Your CMMS has been keeping score the whole time. The data is there. The warnings were clear. The only question is whether anyone will act on them before the next failure makes the decision for you.