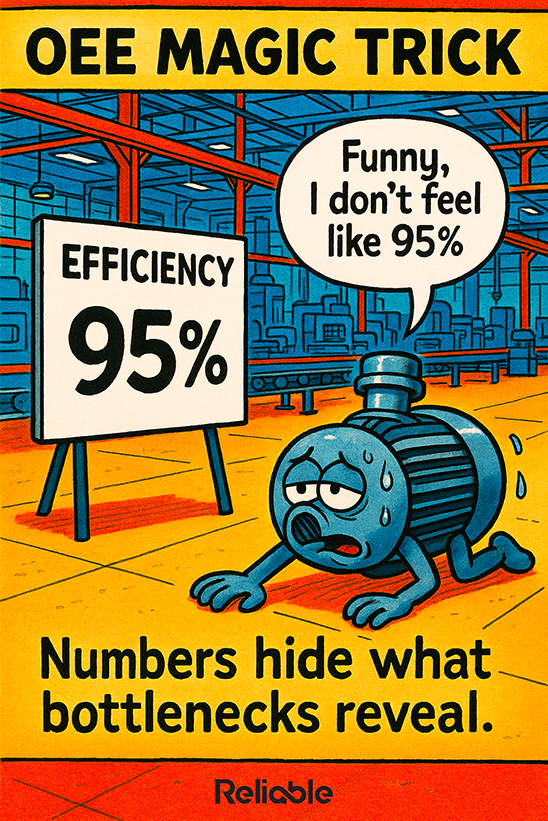

Manufacturing leaders often tout 95% efficiency as a badge of honor. But on the plant floor, the machines tell another story, sluggish production, frequent stops, and exhausted maintenance crews. The cartoon’s message hits home: “Numbers hide what bottlenecks reveal.”
If you want to know how to improve Overall Equipment Effectiveness (OEE) performance, stop chasing numbers and start chasing truth. True efficiency emerges when metrics align with machine reality, not when they serve as management theater.
Redefine What OEE Actually Represents
The first step in learning how to improve OEE performance is to understand what the metric truly measures, and what it often conceals. OEE combines three factors:
- Availability: The ratio of runtime to planned production time.
- Performance: The ratio of actual speed to ideal speed.
- Quality: The ratio of good units to total units produced.
In theory, OEE should pinpoint losses and guide improvement. In practice, it often reflects selective accounting. Many teams exclude micro-stops under 5 minutes, ignore slow cycles, or average performance across multiple lines. The result is a “clean” number that hides messy truths.
To fix it:
- Capture all downtime, even 30-second interruptions.
- Log every slow cycle and speed variance.
- Separate OEE by machine or cell, never aggregate across an entire department.
When OEE is grounded in reality, the data becomes actionable instead of decorative.
Focus on Bottlenecks, Not Averages
A plant’s performance is only as strong as its constraint. Yet traditional OEE reporting blends all equipment together, producing a false sense of uniform excellence. If one bottleneck operates at 70%, the whole system does too, regardless of how many 99% scores exist elsewhere.
To expose true constraints, plot each machine’s OEE on a simple bar chart. The lowest performer is your bottleneck. Improving its availability or speed has the largest leverage on total throughput.
Practical steps to improve OEE at the constraint:
- Conduct a root cause analysis of the top 10 downtime events.
- Standardize startup and changeover routines.
- Eliminate chronic minor stops with operator-led quick fixes.
- Cross-train staff to prevent single-point skill dependencies.
When OEE becomes a tool for identifying and improving the constraint – not a vanity metric – production flow transforms.
The plant’s true efficiency is found where flow slows, not where numbers shine.
Integrate Condition Monitoring with OEE Data
To truly master how to improve OEE performance, connect OEE metrics with condition-based insights. Many plants track OEE and predictive maintenance separately, missing a critical opportunity to correlate data.
For example:
- A performance drop of 3% may coincide with increasing bearing vibration.
- Declining quality scores may correlate with lubricant contamination levels.
- Frequent short stops could align with abnormal thermal readings.
By merging CMMS and condition monitoring data, maintenance planners can predict when efficiency will degrade, and intervene before it does.
This integration turns OEE from a lagging indicator into a leading one. You’re no longer reacting to bad numbers; you’re anticipating them.
Build a Culture That Values Accuracy Over Appearances
The cultural challenge in how to improve OEE performance is that many organizations reward the illusion of progress. Teams inflate OEE to “look good,” creating a feedback loop of misleading data and misplaced priorities.
World-class reliability cultures do the opposite. They embrace brutal honesty.
- Transparency: Share OEE dashboards openly, including losses.
- Accountability: Focus reviews on root causes, not blame.
- Engagement: Involve operators in diagnosing recurring inefficiencies.
For example, one high-performing chemical plant improved its OEE from 81% to 93% in 18 months, not by chasing higher numbers, but by tracking true losses with precision. Operators logged micro-stops, planners cross-linked them to work orders, and reliability engineers tied findings to component wear. The data was ugly at first, but it became gold.
A high number doesn’t make a reliable plant. A transparent one does.
Use Technology to Close the Loop
Improving OEE isn’t just an analytical exercise, it’s an ecosystem change. Advanced analytics platforms and AI-driven dashboards can automate the identification of anomalies, correlate production events, and even simulate improvement scenarios.
To leverage these tools:
- Adopt machine-level sensors for vibration, current draw, and temperature.
- Use AI-based anomaly detection to identify emerging bottlenecks.
- Implement automated work orders when OEE thresholds are breached.
- Visualize performance trends through digital twins that show the cost of inaction.
These steps accelerate the cycle of detection, diagnosis, and correction. The more tightly you connect digital data with human action, the faster your OEE gains compound.
Advanced Strategies for How to Improve OEE Performance
Once the basics are mastered, accurate data, bottleneck focus, and cultural alignment, the next stage in how to improve OEE performance is optimization through advanced analytics and disciplined execution. Top-performing plants treat OEE not as a static KPI, but as a dynamic performance system that drives continuous improvement, maintenance precision, and production excellence.
1. Leverage Predictive Maintenance for Higher Availability
Unplanned downtime destroys OEE. Integrating predictive maintenance tools, vibration analysis, oil analysis, thermal imaging, and AI-based failure prediction, dramatically increases equipment availability. When predictive signals trigger maintenance at the right time, OEE availability improves without over-maintaining assets. Plants using these techniques often reduce downtime by 20–40%, directly boosting OEE scores.
2. Use Real-Time OEE Dashboards for Actionable Visibility
Modern manufacturing execution systems (MES) and digital twins provide live OEE tracking by asset, shift, and product. This visibility allows supervisors to intervene immediately when performance or quality drops. Real-time OEE dashboards also expose hidden losses such as micro-stoppages, minor jams, or slow cycle rates, key targets when learning how to improve OEE performance in fast-moving environments.
3. Standardize Work to Improve Performance and Quality
Inconsistent operating procedures cause performance drift. By implementing standardized work instructions, visual aids, and digital checklists, operators maintain consistent speeds and quality levels. This directly strengthens the Performance and Quality components of OEE.
4. Align OEE Metrics with Business Goals
Finally, link OEE to profitability, throughput, and customer satisfaction. Improving OEE is meaningless if it doesn’t translate to business results. Plants that track cost per good unit, energy use per run, and maintenance cost per output unit gain a truer picture of efficiency.
In short, advanced digital tools, predictive analytics, and disciplined workflows turn OEE from a report into a profit lever. These strategies define the new frontier in how to improve OEE performance, where data drives decisions and every percentage point delivers measurable value.
Conclusion: Making the Numbers Feel Real
When you walk the floor of a truly reliable plant, OEE numbers don’t just look good, they feel good. Machines hum evenly. Operators move with purpose. Maintenance is calm, not chaotic.
Learning how to improve OEE performance is about more than refining a formula, it’s about restoring integrity between the reported and the real. Bottlenecks reveal what averages hide. Accuracy fuels improvement, and transparency sustains it.
Efficiency isn’t a number; it’s a lived experience. And when your equipment “feels” as good as your OEE score says it is, you’ve moved from data management to operational mastery.


