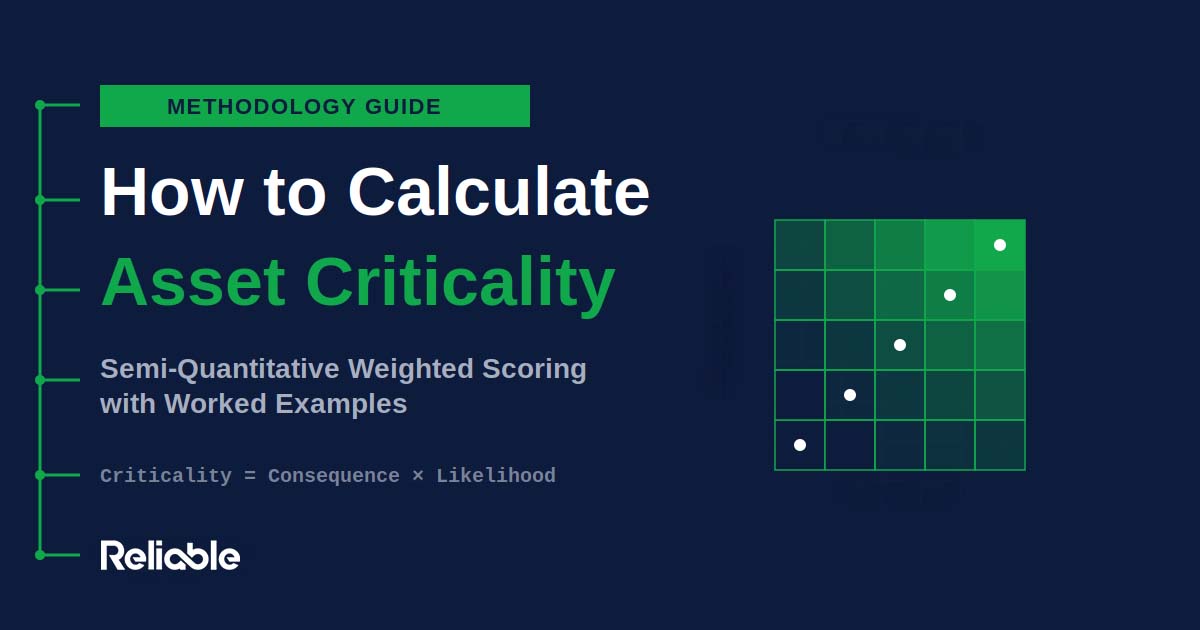

TL;DR: Asset Criticality Analysis (ACA) ranks every asset in an operation by the risk its failure poses, then tiers assets into Critical, Important, and Non-Critical categories that drive maintenance strategy. The standard methodology is semi-quantitative weighted scoring across six consequence categories – Safety, Environment, Production, Quality, Maintenance Cost, and Customer Impact – multiplied by likelihood of failure. The formula is Criticality = Consequence × Likelihood, where Consequence is the weighted sum of category severity scores. ACA is the foundation of risk-based maintenance, the prerequisite for targeted RCM and FMEA, and a required element of ISO 55000-aligned asset management programs. This guide covers methodology, worked examples, common mistakes, and how to translate criticality scores into operational maintenance decisions.
What Asset Criticality Analysis Is and Why It Matters
Asset Criticality Analysis (ACA), also called Asset Criticality Ranking (ACR) or Equipment Criticality Assessment, is a structured methodology for scoring every asset in an operation based on the consequences of failure and the likelihood of failure. The output is a criticality score per asset and a tier classification – typically Critical, Important, and Non-Critical – that determines preventive maintenance intensity, condition monitoring deployment, spare parts stocking, and inspection frequency.
The methodology exists because maintenance resources are finite and asset populations are not. A typical industrial plant has 5,000 to 50,000 maintainable assets. Treating them equally is mathematically impossible and operationally wasteful. Without structured criticality, organizations default to one of two failure modes: equal-treatment maintenance (every asset gets the same PM intensity, which over-maintains low-criticality assets and under-maintains high-criticality assets) or instinct-based prioritization (senior technicians know which assets matter, but that knowledge is undocumented, inconsistent, and walks out the door at retirement).
ACA also serves as the prerequisite analysis for more intensive reliability methodologies. Reliability-Centered Maintenance (RCM) and Failure Mode and Effects Analysis (FMEA) are valuable but expensive – performing them on every asset is economically inefficient because analysis cost exceeds value for non-critical assets. ACA targets RCM and FMEA effort to the 10 to 30 percent of assets where the deeper analysis investment is justified. Mature reliability programs sequence the methodologies: ACA across the full asset base, then RCM or FMEA on the criticality-ranked top tier.
The methodology aligns with several major standards. SMRP Best Practices Framework establishes ACA as a core element of reliability program design. ISO 55000 (Asset Management) requires criticality assessment as part of the asset management plan. ISO 31000 (Risk Management) provides the underlying risk framework. API 580 and 581 (Risk-Based Inspection) apply the same Consequence × Likelihood structure to pressure equipment inspection. ISO 14224 provides the equipment hierarchy and reliability data structure used to organize the analysis.
The Core Formula
The standard formula uses a weighted consequence score multiplied by likelihood:
Criticality Score = Consequence × Likelihood
Where Consequence is the weighted sum of severity scores across multiple categories:
Consequence = (Ssafety × Wsafety) + (Senv × Wenv) + (Sprod × Wprod) + (Squal × Wqual) + (Scost × Wcost) + (Scust × Wcust)
S is the severity score in each category (1 to 5 or 1 to 10) and W is the weight assigned to that category (percentage, total summing to 100 percent or 1.0 in decimal form).
Some methodologies extend the formula by adding Detectability as a third factor:
Criticality Score = Consequence × Likelihood × Detectability
This three-dimensional structure is identical to FMEA’s Risk Priority Number (RPN = Severity × Occurrence × Detection). The two-dimensional version is more common in ACA because Detectability scoring is asset-specific (depends on instrumentation deployed) and frequently changes faster than Consequence or Likelihood, making it cleaner to handle separately in maintenance strategy decisions rather than in the criticality score itself.
The Eight-Step Methodology
Step 1: Define Asset Hierarchy and Analysis Boundary
The first decision in any ACA program is which assets will be analyzed. ISO 14224 defines nine hierarchy levels from industry (Level 1) through component (Level 9), and the analysis level is consequential. Most ACA programs analyze at the maintainable item level (Level 6 in ISO 14224) — the level at which preventive maintenance tasks are performed. Analyzing too high (system level) loses the granularity needed for maintenance strategy decisions. Analyzing too low (component level) generates too many records to score effectively.
The analysis boundary must be documented explicitly: which sites are included, which units, which systems, which equipment classes. Boundary disputes are the most common cause of ACA program failure because operations and maintenance teams disagree on what constitutes a maintainable asset (is the gearbox-motor-coupling assembly one asset or three?), and different decisions produce different results that cannot be reconciled later.
The standard hierarchy approach uses ISO 14224 Levels 4 through 6:
- Level 4 – Plant or Unit: The complete operating unit (e.g., “Olefins Unit 1,” “Wastewater Treatment Plant 2”). Used for reporting and capital planning, not for ACA scoring.
- Level 5 – Section or System: Functional groupings within the plant (e.g., “Cooling Water System,” “Distillation Train 3”). Used for analysis boundary definition and scoring context.
- Level 6 – Equipment Unit (Maintainable Item): The asset record at which PMs are scheduled and work orders are written (e.g., “Cooling Water Pump P-101A,” “Reflux Drum V-203”). This is the standard ACA scoring level.
Define the boundary, document it, get senior operations leadership signoff before proceeding. Time invested at this step prevents weeks of rework later.
Step 2: Define Consequence Categories and Severity Scales
The standard six consequence categories are:
- Safety – impact on personnel injury or fatality
- Environment – impact on regulatory exposure, remediation cost, and emissions
- Production (Operational Impact) – impact on operational throughput, downtime cost, and revenue loss
- Quality – impact on product defects, scrap, rework, and customer consequence
- Maintenance Cost – direct repair, parts, and labor cost from failure
- Customer or Brand Impact – impact on customer commitments, contractual penalties, and reputation
Some operations add a seventh category – Regulatory Compliance – separately from Environment. This is typical in pharmaceutical (FDA 21 CFR Part 11), food and beverage (FSMA), nuclear (NRC), and aviation (FAA) operations where compliance failures have unique consequences distinct from environmental impact.
For each category, define a 5-point or 10-point severity scale with explicit, organization-specific descriptions for each level. Generic scales fail because team members interpret them differently – one engineer’s “moderate impact” is another’s “severe impact” without anchored definitions.
Example Safety severity scale (5-point):
- 1 – Negligible: No injury, no first aid required
- 2 – Minor: First aid case, no lost time
- 3 – Moderate: Lost time injury, recordable incident, full recovery expected
- 4 – Major: Permanent disability, single fatality possible, OSHA reportable
- 5 – Catastrophic: Multiple fatalities, mass casualty event, community impact
Example Production severity scale calibrated for a $500 million annual revenue process plant:
- 1 – Negligible: Less than $10,000 production impact, no schedule effect
- 2 – Minor: $10,000 to $100,000 production impact, minor schedule recovery
- 3 – Moderate: $100,000 to $1 million production impact, customer commitment risk
- 4 – Major: $1 million to $10 million production impact, significant schedule disruption
- 5 – Catastrophic: Greater than $10 million production impact, prolonged shutdown
Severity scales must be calibrated to the specific operation. A $50,000 production loss is catastrophic in a small specialty chemical operation and routine in a major refinery. Borrowing scales from another organization or industry produces scoring that misrepresents actual operational reality.
Step 3: Assign Category Weightings
Assign weighting factors to each consequence category that reflect organizational priorities. Total weights must sum to 100 percent (or 1.0 in decimal form).
Typical industrial weightings:
| Category | Heavy Industry / Process | Discrete Manufacturing | Pharma / Regulated |
|---|---|---|---|
| Safety | 30% | 25% | 25% |
| Environment | 20% | 10% | 15% |
| Production | 25% | 25% | 15% |
| Quality | 5% | 20% | 15% |
| Maintenance Cost | 10% | 10% | 5% |
| Customer Impact | 10% | 10% | 5% |
| Regulatory Compliance | – | – | 20% |
| Total | 100% | 100% | 100% |
Heavy industry and process operations weight Safety and Environment highest because the consequence of major failure (refinery fires, chemical releases, gas pipeline ruptures) dwarfs the consequence of production loss. Discrete manufacturing typically weights Quality more heavily because product quality failures generate customer returns, warranty claims, and brand damage that exceed the production cost of the failure event itself. Pharmaceutical and other regulated industries add Regulatory Compliance because FDA observations, recalls, and consent decrees produce consequences that don’t map cleanly to Environment or Production.
Weighting decisions must be approved by senior leadership before scoring begins. Changing weights mid-analysis invalidates prior work and cascades through every subsequent score. Document the weighting rationale, get sign-off, and lock the weights for the analysis cycle.
Step 4: Score Each Asset Across All Categories
Convene a cross-functional analysis team and score each asset against every consequence category using the defined severity scales. The team must include:
- Operations representative – provides production impact context and operational dependencies
- Maintenance representative – provides failure history, repair complexity, and parts availability context
- Safety representative – provides safety consequence context, particularly for hazardous materials
- Engineering representative – provides design context, redundancy information, and failure mode analysis
- Quality representative – provides product quality consequence context (in manufacturing operations)
- Process safety representative – provides PSM-level consequence context (in chemical, oil and gas, and similar PSM-regulated operations)
The scoring rule that drives consistency: assume the worst credible failure mode (not the most likely failure mode) when scoring consequence. A pump that normally fails from bearing wear (moderate consequence) but could fail from seal rupture in hazardous service (catastrophic consequence) gets scored against the seal rupture scenario. Document the failure mode considered for each score so the analysis is reviewable.
Single-person scoring is the second most common cause of ACA program failure after boundary disputes. The cross-functional team is what produces consistent, defensible scoring. The same asset scored by Operations alone, Maintenance alone, and Safety alone produces three different scores. Cross-functional scoring forces the disagreements into the open during analysis where they can be resolved through evidence rather than after deployment when reconciliation is impossible.
Step 5: Calculate Weighted Consequence Score
For each asset, calculate the weighted consequence score by multiplying the score in each category by the category weight and summing the products.
Worked Example 1: Cooling Water Pump P-101A
A primary cooling water pump in a chemical plant olefins unit. Heavy industry weighting (30/20/25/5/10/10).
| Category | Severity Score (1-5) | Weight | Weighted Score |
|---|---|---|---|
| Safety | 2 (minor – secondary containment in place) | 30% | 0.60 |
| Environment | 2 (minor – water release contained) | 20% | 0.40 |
| Production | 5 (catastrophic – unit shutdown if both A and B fail) | 25% | 1.25 |
| Quality | 3 (moderate – product specification drift) | 5% | 0.15 |
| Maintenance Cost | 2 (minor – spare on site, 8-hour repair) | 10% | 0.20 |
| Customer Impact | 3 (moderate – customer commitment delays) | 10% | 0.30 |
| Consequence Score | – | 100% | 2.90 |
The Consequence Score of 2.90 is on the same 1-to-5 scale as the input severity scores. This pump has moderate-to-high consequence driven primarily by Production impact, with secondary contribution from Customer Impact.
Step 6: Apply Likelihood (Probability of Failure)
Multiply the weighted consequence score by a likelihood factor representing the probability of failure within the analysis time horizon (typically one year).
Likelihood is scored on the same scale as consequence (1 to 5 or 1 to 10) using:
- Historical failure data – actual failure frequency from CMMS records over 3 to 5 years
- Condition monitoring trends – vibration trends, oil analysis trends, thermography data
- Asset age relative to design life – assets approaching or exceeding design life have elevated likelihood
- Operating context – assets running outside design conditions have elevated likelihood
- Maintenance history – assets with deferred PMs or known defects have elevated likelihood
Example Likelihood scale (5-point) using annual failure probability:
- 1 — Very Unlikely: Less than 1% probability per year (mean time between failures > 100 years)
- 2 — Unlikely: 1% to 5% probability per year (MTBF 20 to 100 years)
- 3 — Possible: 5% to 25% probability per year (MTBF 4 to 20 years)
- 4 — Likely: 25% to 75% probability per year (MTBF 1.3 to 4 years)
- 5 — Almost Certain: Greater than 75% probability per year (MTBF < 1.3 years)
Continuing the worked example: P-101A has a 3-year MTBF based on historical failure data. Likelihood score = 3 (Possible).
Criticality Score = Consequence × Likelihood = 2.90 × 3 = 8.70
On a 1-to-25 scale (5 × 5 maximum), this asset’s criticality score of 8.70 places it in the moderate-to-high range.
Step 7: Tier Assets by Criticality Score
Plot all assets on a risk matrix or rank them by criticality score and apply Pareto-style cutoffs to define tiers.
Standard three-tier classification on a 1-to-25 scale:
- Tier 1 – Critical (top 10 to 20% of assets): Criticality score typically 12 to 25. These assets receive condition-based or predictive maintenance with on-site spares and quarterly review. RCM analysis is justified.
- Tier 2 – Important (next 30 to 40% of assets): Criticality score typically 5 to 12. These assets receive scheduled preventive maintenance with regional spares and annual review. Streamlined RCM or generic PM templates appropriate.
- Tier 3 – Non-Critical (remaining 50 to 60% of assets): Criticality score typically below 5. These assets receive run-to-failure or minimal PM with vendor-supplied spares. Review only triggered by failures or operational changes.
Some methodologies use four or five tiers. The classical Life Cycle Engineering approach uses six tiers (Criticality 1 through 6). The exact cutoffs are organization-specific but must produce actionable tier sizes — a Critical tier containing 60 percent of assets is no longer prioritization, and a Critical tier containing 1 percent of assets typically misses meaningful risk.
The 80/20 principle generally applies: 10 to 20 percent of assets account for 80 percent of operational risk. The ACA tiering should reflect this distribution.
Step 8: Translate Tiers to Maintenance Strategy
Map each criticality tier to a maintenance strategy that defines PM intensity, condition monitoring deployment, spare parts stocking, and review frequency. The tier-to-strategy mapping is the actual deliverable that converts ACA from a scoring exercise into operational results.
Example tier-to-strategy mapping:
| Element | Tier 1 (Critical) | Tier 2 (Important) | Tier 3 (Non-Critical) |
|---|---|---|---|
| Maintenance Strategy | Predictive / Condition-based | Time-based preventive | Run-to-failure or minimal PM |
| Condition Monitoring | Continuous (online sensors) | Periodic (route-based) | None or visual only |
| Spare Parts | On-site (storeroom) | Regional (24-hour delivery) | Vendor-supplied (lead time acceptable) |
| RCM/FMEA Analysis | Required (full SAE JA1011 RCM) | Streamlined RCM or generic templates | Not required |
| Criticality Review Frequency | Quarterly | Annual | Triggered by failures or changes |
| Operator Care | Operator basic care + technician PM | Technician PM | Reactive only |
Continuing the worked example: P-101A’s criticality score of 8.70 places it on the boundary between Tier 1 and Tier 2. The team should examine the score components to make the tier decision. The high Production score (5) suggests the asset functionally behaves as Tier 1 even though the aggregate score is moderate. In practice, single-category scores of 5 in Safety, Environment, or Production typically warrant Tier 1 classification regardless of aggregate score, because catastrophic single-category consequence is operationally meaningful even when other categories are low.
Worked Example 2: Conveyor Drive Motor M-405
A conveyor drive motor in a discrete manufacturing operation. Discrete manufacturing weighting (25/10/25/20/10/10).
| Category | Severity Score | Weight | Weighted |
|---|---|---|---|
| Safety | 2 (minor – guarded mechanical hazard) | 25% | 0.50 |
| Environment | 1 (negligible – no environmental release) | 10% | 0.10 |
| Production | 3 (moderate – line slowdown, alternative routing available) | 25% | 0.75 |
| Quality | 2 (minor – temporary quality drift) | 20% | 0.40 |
| Maintenance Cost | 2 (minor – common spare, 4-hour repair) | 10% | 0.20 |
| Customer Impact | 2 (minor – minor schedule recovery) | 10% | 0.20 |
| Consequence | – | 100% | 2.15 |
Likelihood: Motor MTBF approximately 8 years based on historical data. Likelihood score = 2 (Unlikely).
Criticality Score = 2.15 × 2 = 4.30 → Tier 3 (Non-Critical)
This conveyor drive motor is non-critical and warrants run-to-failure or minimal PM strategy. The maintenance team would invest condition monitoring and PM resources elsewhere.
Worked Example 3: Pharmaceutical Sterile Filling Line Filler F-A02
A sterile vial filler in a pharma fill-finish operation. Pharma weighting (25/15/15/15/5/5/20 with Regulatory Compliance added).
| Category | Severity Score | Weight | Weighted |
|---|---|---|---|
| Safety | 2 (minor — operator handling injury) | 25% | 0.50 |
| Environment | 1 (negligible) | 15% | 0.15 |
| Production | 5 (catastrophic — single line, no redundancy) | 15% | 0.75 |
| Quality | 5 (catastrophic — sterility failure, batch loss) | 15% | 0.75 |
| Maintenance Cost | 3 (moderate — specialized spares, validation) | 5% | 0.15 |
| Customer Impact | 4 (major — patient supply disruption) | 5% | 0.20 |
| Regulatory Compliance | 5 (catastrophic — FDA observation, potential consent decree) | 20% | 1.00 |
| Consequence | — | 100% | 3.50 |
Likelihood: Filler MTBF approximately 2 years. Likelihood score = 4 (Likely).
Criticality Score = 3.50 × 4 = 14.00 → Tier 1 (Critical)
This filler is solidly Tier 1, with multiple severity-5 categories driving the high consequence score. The pharma weighting captures the regulatory exposure that horizontal weightings would miss – a Quality severity of 5 alone is catastrophic, but the Regulatory Compliance category at 20% weight reflects that pharma quality failures generate FDA consequences that compound the production loss.
Common Mistakes That Invalidate ACA Programs
The methodology is well-defined, but ACA program failure is common. The recurring patterns:
Single-person scoring. The same asset scored by Operations alone, Maintenance alone, and Safety alone produces three different scores. Cross-functional scoring is not optional – it’s what produces consistent, defensible results. Programs that compromise on the cross-functional team to save time produce scoring that cannot be defended in audits or operational reviews.
Generic severity scales. Borrowed scales from other organizations or generic industry templates produce scoring that misrepresents operational reality. Severity scales must be calibrated to the specific operation’s revenue, safety profile, regulatory exposure, and customer commitments. The calibration work is unglamorous but essential.
Scoring against the most likely failure mode rather than the worst credible failure mode. A pump that normally fails from bearing wear (moderate consequence) but could fail from seal rupture in hazardous service (catastrophic consequence) must be scored against the seal rupture scenario. ACA captures consequence severity, not consequence frequency – the likelihood factor handles frequency separately.
Boundary disputes resolved during scoring rather than before. Operations and maintenance teams must agree on what constitutes a maintainable asset before scoring begins. Boundary decisions made mid-analysis produce inconsistent results across the asset population that cannot be reconciled later.
Weight changes mid-analysis. Weighting decisions must be locked before scoring begins. Changing weights after partial completion invalidates prior work and cascades through every subsequent score. Document weights, get senior leadership approval, lock the cycle.
Treating ACA as a one-time exercise. Operations evolve. Equipment ages. Regulatory frameworks change. Static criticality scores deteriorate in usefulness as conditions change. Critical assets should be reviewed quarterly, Important assets annually, Non-Critical assets when triggered. ISO 55000 requires this review cycle to be documented in the asset management plan.
Skipping the tier-to-strategy mapping. ACA’s value comes from translating criticality scores into operational maintenance decisions. Programs that produce excellent scoring but fail to translate scores into PM strategy, condition monitoring deployment, and spare parts stocking decisions deliver no operational value. The strategy mapping is the deliverable.
Using ACA without subsequent RCM or FMEA on the critical tier. ACA identifies which assets matter; it does not specify what maintenance to perform. Critical assets require deeper failure mode analysis (RCM or FMEA) to determine the optimal maintenance strategy. Operations that stop at ACA without performing RCM on Tier 1 assets typically over-maintain critical assets through generic high-frequency PMs that are not optimal for the specific failure modes.
How ACA Relates to RCM, FMEA, and APM
Asset Criticality Analysis sits at the foundation of a layered reliability methodology stack. Each methodology operates at a different level and serves a different purpose.
ACA operates at the asset level. Which assets matter? The output is a tiered asset population.
RCM operates at the function level. For these critical assets, what failures matter and what maintenance addresses them? The output is a maintenance strategy per asset, structured by SAE JA1011’s seven questions and addressing the four failure consequence categories (hidden, safety/environmental, operational, non-operational). See our RCM methodology guide for the full framework.
FMEA operates at the failure mode level. For these critical functions, how does each component fail, what are the effects, and how do we detect or prevent each mode? The output is a Risk Priority Number (RPN) and recommended actions per failure mode. See our FMEA methodology guide for the full framework.
APM (Asset Performance Management) operates at the operational layer. Once ACA, RCM, and FMEA define the strategy, APM platforms execute the strategy by monitoring asset health, predicting failures, and triggering work orders. ACA scoring feeds directly into APM platform configuration — the criticality tier determines the analytics depth, monitoring frequency, and alarm thresholds applied to each asset. See our APM platform comparison for the platform landscape.
The standard sequence in mature programs: ACA across the full asset base, then RCM or FMEA on the Critical tier (typically 10 to 20 percent of assets), then APM platform configuration informed by ACA tiers and RCM/FMEA outputs. Skipping ACA forces RCM and FMEA effort to be spread thinly across all assets, which is economically inefficient. Skipping RCM and FMEA after ACA leaves Critical assets without optimized maintenance strategy.
ACA in CMMS Platforms
Modern CMMS and EAM platforms support ACA implementation natively. The key capabilities to evaluate:
- Criticality field on asset records: The criticality score and tier should be a first-class asset attribute, not a custom field. This enables filtering, reporting, and strategy automation.
- Tier-driven PM templates: The CMMS should support PM template assignment driven by criticality tier — Tier 1 assets automatically receive the Tier 1 PM template, Tier 2 the Tier 2 template.
- Criticality-aware spare parts stocking: Inventory minimums should reflect criticality tier, with Tier 1 assets driving on-site stocking and Tier 3 assets allowing vendor-supplied parts.
- Review cycle tracking: Quarterly Tier 1 reviews and annual Tier 2 reviews should be tracked as work orders against the asset rather than managed in spreadsheets.
- Risk matrix visualization: Plotting assets on Consequence × Likelihood matrices for visual review during planning sessions.
Tier 1 enterprise EAM platforms (IBM Maximo, SAP S/4HANA, AVEVA APM, Hexagon EAM, Infor EAM) support these capabilities natively. Mid-market CMMS platforms (eMaint, MaintainX, Limble, UpKeep) typically support criticality through configuration with varying depth. Operations evaluating CMMS should verify criticality support depth specifically rather than assuming the capability is present.
Honest Middle Ground
The methodology is well-defined, but there are real limits and contested areas worth acknowledging.
Semi-quantitative scoring is not quantitative analysis. ACA produces ordinal rankings (Tier 1, 2, 3) that are useful for prioritization but not for absolute risk quantification. Operations seeking quantitative risk analysis (probabilistic risk assessment, layer of protection analysis, quantitative risk assessment) need methodologies beyond ACA. ACA is the appropriate first-pass methodology for prioritization; deeper quantitative analysis applies to the small subset of Tier 1 assets where the analysis investment is justified.
The 80/20 distribution is not always real. Most assets follow Pareto risk distribution, but specific operations sometimes have flat risk distributions where 50 percent of assets contribute meaningful risk. Operations with high redundancy, similar asset populations, or homogeneous operating context may not produce clean Tier 1/2/3 separation. The methodology accommodates this through tier cutoff adjustment, but the result is less actionable than a clean Pareto distribution.
Cross-functional team scoring is expensive. Doing ACA properly with a 5-person cross-functional team scoring 5,000 to 50,000 assets requires hundreds to thousands of person-hours. Many organizations cannot sustain this effort and produce ACA programs that are technically incomplete but operationally sufficient. The honest framing: 80 percent ACA implemented consistently delivers more value than 100 percent ACA that takes three years and is obsolete by completion.
Detectability is real but often handled separately. The three-dimensional formula (Consequence × Likelihood × Detectability) is structurally complete but creates analytical complications. Detectability changes faster than Consequence or Likelihood (new sensor deployment can drop Detectability score from 5 to 2 overnight), and conflating it into the Criticality Score makes the score volatile in ways that complicate maintenance strategy decisions. Many mature programs handle Detectability in the maintenance strategy mapping rather than in the criticality score itself – assets with low detectability get more aggressive condition monitoring at any tier rather than being elevated to a higher tier.
ACA does not tell you what maintenance to do. ACA identifies which assets matter and at what level. RCM and FMEA determine what maintenance to perform on those critical assets. Operations that stop at ACA and apply generic high-frequency PMs to Tier 1 assets typically over-maintain through tasks that are not optimal for the specific failure modes. The methodology stack is sequential – ACA enables targeted RCM and FMEA, which then specify maintenance content.
Frequently Asked Questions
What is Asset Criticality Analysis?
Asset Criticality Analysis (ACA) is a structured methodology for scoring every asset in an operation based on consequences of failure and likelihood of failure, then tiering assets to drive maintenance strategy. The output is a criticality score per asset and a tier classification (typically Critical, Important, Non-Critical) that determines preventive maintenance intensity, condition monitoring deployment, spare parts stocking, and inspection frequency. ACA is the foundation of risk-based maintenance and a prerequisite for targeted RCM and FMEA analysis.
What is the formula for asset criticality?
The standard formula is Criticality = Consequence × Likelihood, where Consequence is calculated as the weighted sum of severity scores across multiple categories: Consequence = (Safety × W_safety) + (Environment × W_env) + (Production × W_prod) + (Quality × W_qual) + (Cost × W_cost) + (Customer × W_cust). Some methodologies add Detectability: Criticality = Consequence × Likelihood × Detectability, which is structurally identical to FMEA’s RPN.
What categories should be used for asset criticality scoring?
The standard six categories are Safety, Environment, Production, Quality, Maintenance Cost, and Customer Impact. Pharmaceutical and other regulated industries typically add Regulatory Compliance as a seventh category. Categories must be defined explicitly with organization-specific severity scales rather than borrowed generic templates.
How are weighting factors determined?
Weighting factors are determined by senior leadership consensus before scoring begins. Total weights must sum to 100 percent. Heavy industries typically weight Safety (25-35%) and Environment (15-25%) highest. Discrete manufacturing weights Quality more heavily. Regulated industries add Regulatory Compliance at 15-25%. Weights must be locked for the analysis cycle.
How does ACA relate to RCM and FMEA?
ACA operates at the asset level (which assets matter), RCM at the function level (what failures matter), and FMEA at the failure mode level (how each component fails). The standard sequence is ACA across the full asset base, then RCM or FMEA on the top 10-30% of assets where deeper analysis is justified. Performing RCM or FMEA on every asset is economically inefficient.
What is the difference between ACA and Risk-Based Inspection (RBI)?
ACA and RBI share the same Risk = Consequence × Likelihood framework but apply it to different problems. ACA ranks assets to drive overall maintenance strategy. RBI specifically targets inspection programs for static equipment (pressure vessels, piping, storage tanks) under API 580/581. Most chemical and oil and gas operations use both — ACA for general maintenance prioritization, RBI for pressure equipment inspection optimization.
How often should asset criticality be reviewed?
Tier 1 assets should be reviewed quarterly. Tier 2 annually. Tier 3 only when triggered by failures or operational changes. Re-analysis should also be triggered by significant operational changes, regulatory changes, major incidents, mergers and acquisitions, or condition deterioration. ISO 55000 requires the review cycle to be documented in the asset management plan.
What is the most common cause of ACA program failure?
Boundary disputes (operations and maintenance disagreeing on what constitutes a maintainable asset) and single-person scoring (one person scoring assets without cross-functional team validation) are the two most common causes. Generic severity scales borrowed from other organizations is the third most common cause. All three are preventable through pre-deployment process design.
Related Guides
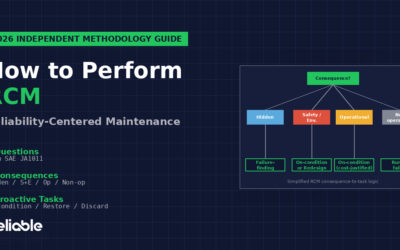
- How to Perform RCM: Reliability-Centered Maintenance Methodology
- How to Perform FMEA: Failure Mode and Effects Analysis
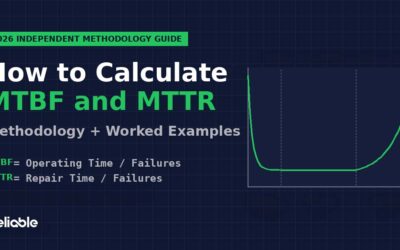
- How to Calculate MTBF and MTTR: Methodology and Worked Examples
- How to Calculate OEE: Methodology and Worked Examples
- Best Asset Performance Management Software 2026
- Best CMMS Software 2026: Independent Comparison
- APM vs CMMS: What’s the Difference?
Sources & References
- SMRP Best Practices Framework – Society for Maintenance & Reliability Professionals
- ISO 55000:2014 – Asset Management – Overview, principles and terminology
- ISO 31000:2018 – Risk Management Guidelines
- ISO 14224:2016 – Petroleum, petrochemical and natural gas industries – Collection and exchange of reliability and maintenance data for equipment
- API RP 580 – Risk-Based Inspection
- API RP 581 – Risk-Based Inspection Methodology
- SAE JA1011 – Evaluation Criteria for Reliability-Centered Maintenance (RCM) Processes
This guide is updated quarterly. Last review: May 2026. View all Reliable guides.