

Cost estimates shape decisions long before a shutdown begins. They influence funding, contracting, labor plans, material readiness and the timing of work that can affect an entire facility. For Turnaround and Inspection (T&I) projects, the challenge is especially demanding because a concentrated execution window can contain inspection findings, scope changes and resource constraints that are difficult to predict from a single planning assumption.
Historical project data offers another way to approach that uncertainty. Rather than relying only on individual experience or a single cost driver, machine learning (ML) can examine several variables together and identify patterns that may not be obvious in conventional estimating. The objective is not to replace facility managers, estimators or project teams. It is to give them an additional evidence-based view before a budget or shutdown plan is finalized.
From historical records to a planning advantage
A four-year dataset from 14 oil and gas facilities was used as a practical case study. The records included project characteristics such as division, equipment type, planned cost, planned and actual duration, cost center and year. The model target was Total Actual Cost. Although the source data came from one operating environment, the workflow is relevant to facility portfolios globally because the underlying problem is common: organizations often possess years of completed-project information but do not consistently turn it into forward-looking insight.
The case data also illustrates why prediction is not straightforward. Planned cost ranged from 0 to 15,370,198, while actual cost ranged from 0 to 1,717,027. Planned duration averaged 355.2 days and actual duration averaged 56.7 days. The dataset contained zero actual costs and even a negative duration, highlighting a fundamental lesson for facility management: data quality is part of the forecasting problem, not a separate information-technology issue.
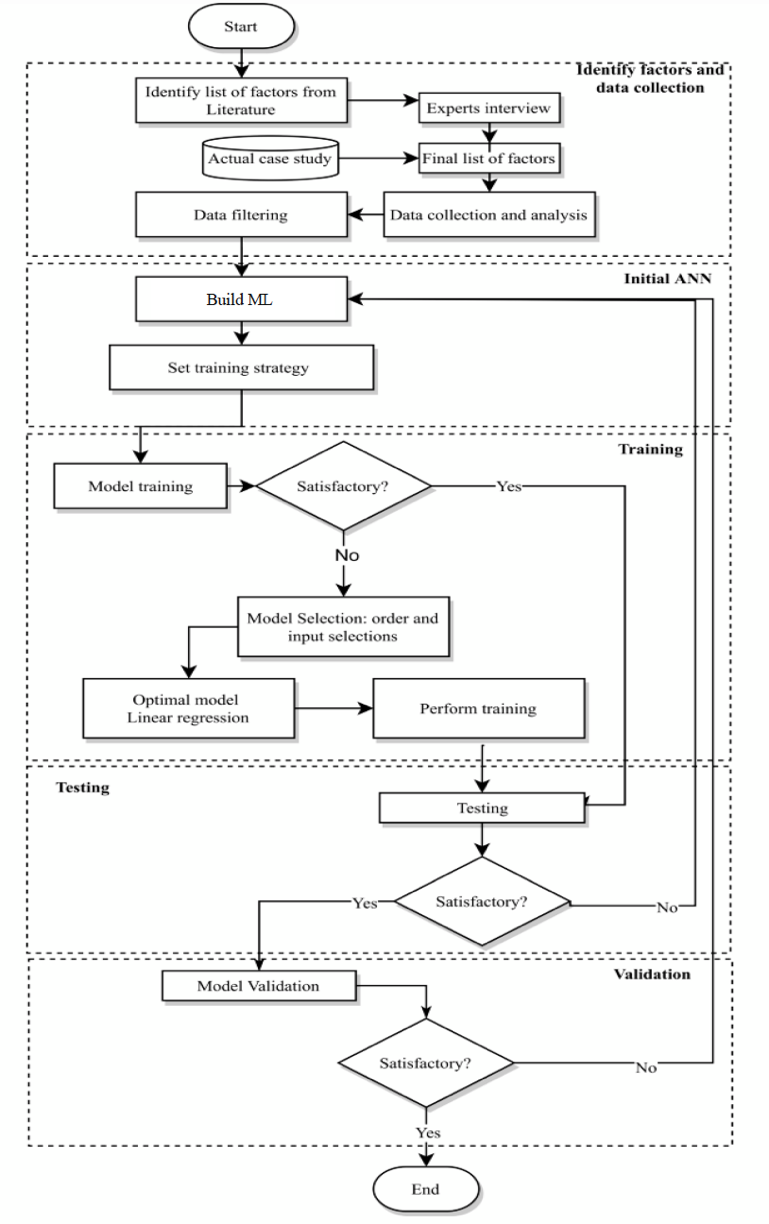
Figure 1. A structured workflow moves from factor identification and data preparation through model development, training, testing and validation.
Start with the decision, not the algorithm
A useful predictive initiative begins by defining the management decision it is intended to support. For a T&I cost model, the target might be the expected actual cost at a specific planning gate. The team should identify what information is genuinely available at that point, how much forecast error is tolerable and what action will follow when the model differs materially from the conventional estimate.
This step prevents a common analytical mistake: building a model that performs well in a study but uses information that would not exist when a real decision is made. It also keeps the work tied to an operational outcome. A model should answer a planning question, not simply produce a technically impressive score.
Build a dataset that can be trusted
Completed projects should be assembled using consistent definitions. At minimum, records may include asset or equipment type, planned cost, planned duration, organizational area, cost center and year. Where available, stronger operational variables can include equipment age, labor hours, material quantities, work-scope growth, contractor mix, procurement lead times, discovery work and schedule changes.
Cleaning should be documented rather than treated as an automatic software step. Missing values, unexplained zero costs, inconsistent dates and outliers require review against source records. An anomaly may represent an error, a canceled scope or a legitimate exceptional project. Those possibilities have different implications. Removing unusual values simply because they make the model harder to fit can create a cleaner dataset but a less realistic planning tool.
Compare simple and advanced methods
The research considered Multiple Linear Regression (MLR), Support Vector Machines (SVM) and a Multilayer Perceptron (MLP) neural network. Beginning with a simpler baseline is useful because complexity should earn its place. If an advanced model does not materially improve performance on unseen data, the simpler approach may be easier to explain, govern and maintain.
The selected MLP is designed to capture nonlinear relationships among several inputs. In practical terms, that matters when no single variable explains cost particularly well but combinations of variables contain useful information. The model used seven inputs and processed them through scaling and perceptron layers before producing a predicted Total Actual Cost.
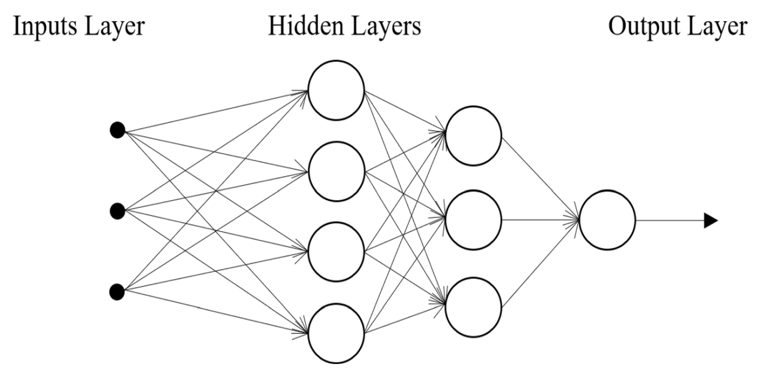
Figure 2. A Multilayer Perceptron (MLP) uses connected input, hidden and output layers to learn nonlinear patterns.
What weak correlations can still reveal
Individual relationships in the case dataset were generally modest. Planned cost had a correlation of 0.106 with actual cost. Planned duration and actual duration had correlations of 0.268 and 0.236 with actual cost. Equipment type also showed only a limited relationship. Those results caution against using any one variable as a shortcut for forecasting.
The scatter plots make the point visually. Actual costs vary widely even when planned costs or durations are similar. For facility teams, this is valuable before any model is trained. Basic plots can reveal outliers, unexpected clusters and weak assumptions in the estimating process. They can also help teams decide which additional variables should be captured in future projects.
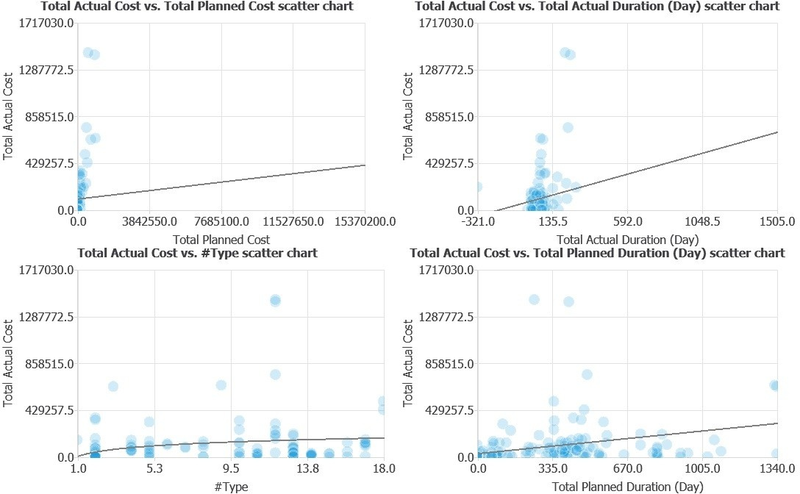
Figure 3. Actual cost compared with planned cost, actual duration, equipment type and planned duration. The wide dispersion shows why several variables may be needed for useful forecasting.
Test performance beyond the training data
The dataset was separated into training, validation and testing groups using an 80-10-10 split. Training data fits the model, validation data supports model selection and tuning, and testing data provides an independent check. This separation is essential because a model can learn historical records extremely well and still perform poorly on the next project.
Several metrics provide different perspectives. Mean Squared Error (MSE) emphasizes larger misses because errors are squared. Root Mean Squared Error (RMSE) expresses that error on the original scale. Mean Absolute Error (MAE) describes the average absolute difference between prediction and outcome. The coefficient of determination (R²) indicates how much of the observed variance is explained by the model. No single metric should be treated as a complete verdict.
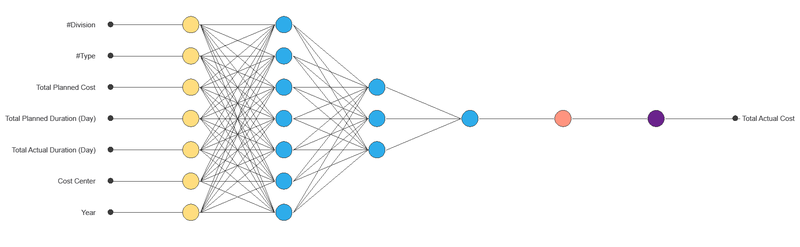
Figure 4. The case-study neural network used seven inputs, scaling and multiple perceptron layers to produce a Total Actual Cost prediction.
Promising results, with an important caution
The neural network was trained with a quasi-Newton optimization method over 27 epochs. Reported training error declined from 5.8847 to 0.0721, while selection error declined from 1.9593 to 0.6143. The reported R² was 0.866241, indicating that the selected inputs explained about 86.6% of the variance in actual cost within the study dataset.
That result is encouraging, but it should not be interpreted as proof of universal accuracy. Testing RMSE was 149.629 compared with 56.094 for training, and the goodness-of-fit chart shows greater dispersion for some higher-cost observations. The gap reinforces a core principle of responsible analytics: performance on historical training data is less important than performance on projects the model did not use to learn.
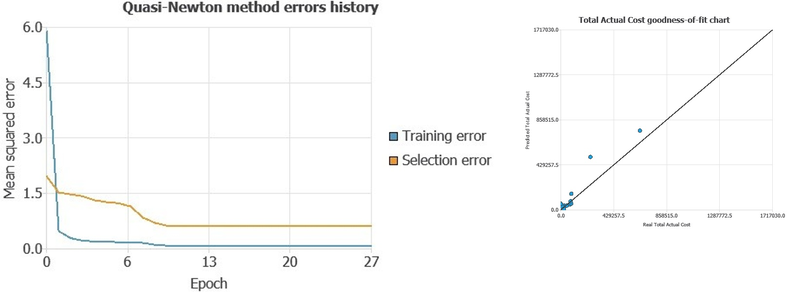
Figure 5. Training and selection error history alongside the actual-versus-predicted goodness-of-fit view. Validation remains necessary even when overall fit is strong.
Turn the forecast into a management control
The most useful implementation is not an automated budget approval. A predictive estimate can sit beside the conventional project estimate as a challenge or assurance value. If the difference exceeds a defined threshold, the project team can review the assumptions: Is the scope unusual? Are market conditions different from the historical period? Is key information missing? Has the traditional estimate overlooked a pattern seen repeatedly in earlier work?
This approach keeps human judgment in the decision while making that judgment more informed. It also creates a feedback loop. After each completed T&I, the organization can compare predicted and actual results, record the causes of major deviations and decide whether new variables should be captured. Over time, the dataset becomes not only larger but more useful.
For facility management organizations, the strongest business case may be improved consistency rather than a single percentage improvement in accuracy. A documented model gives different teams a common reference point when reviewing estimates, while the variance between model and conventional estimates creates a structured reason to challenge assumptions. This can be particularly useful in portfolios where knowledge is distributed across planners, maintenance specialists, project engineers, contractors and finance teams. The forecast becomes a conversation tool: it highlights where experience and historical evidence agree, and where further investigation is justified before resources are committed.
From prediction to better planning
Machine learning can add value to T&I planning when it is built on disciplined data and connected to a clear management decision. The case study shows that a neural network can identify useful multivariable patterns even when individual cost drivers have weak correlations with actual cost. Its reported fit is promising, while the higher errors on unseen data provide an equally useful reminder that every forecast has limits.
For facility managers, the transferable lesson is broader than one algorithm. Better forecasting comes from a repeatable process: define the decision, improve the historical record, compare methods, test independently, examine errors and keep professional review in control. When those practices are in place, historical project data can move from an archive of what happened to a practical tool for deciding what should happen next.