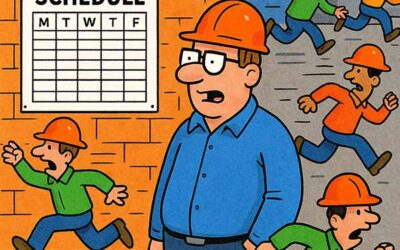

Every maintenance manager has wrestled with the question of how to reduce spare parts costs. Procurement sends a purchase order for the cheapest bearing on the market, the storeroom fills up with off-brand replacements, and within six weeks the same pump is down again.
The math looked good on the requisition form. It looks terrible on the downtime report.
This cycle repeats in plants everywhere because cost reduction gets measured at the point of purchase rather than the point of failure. A $40 bearing that lasts three months costs more per operating hour than a $120 bearing that lasts three years. That ratio only gets worse once you factor in labor, lost production, and emergency shipping for the second (or third) replacement.
The temptation to buy cheap is understandable. Maintenance budgets are tight, procurement teams face pressure to hit cost targets, and the consequences of a bad part don’t show up on anyone’s scorecard for weeks or months. By the time the failure happens, nobody connects it back to the sourcing decision.
The Real Cost of Cheap Spare Parts
Purchase price accounts for roughly 10% to 15% of a spare part’s total cost of ownership. The rest lands in storage, installation labor, machine downtime, and the cascade of scheduling disruptions that follow an unplanned failure. When a plant buys cheap, it’s optimizing the smallest slice of the pie.
Consider a real scenario: a facility replaces a budget coupling on a critical conveyor drive. The coupling fails after 11 weeks. The replacement itself costs $85, but the four hours of unplanned downtime cost $22,000 in lost throughput.
That’s a 258:1 ratio of consequence to savings. One bad part created a problem 258 times more expensive than the money it saved.
Purchase price accounts for roughly 10% to 15% of a spare part’s total cost of ownership. The rest lands in storage, installation labor, machine downtime, and scheduling disruptions.
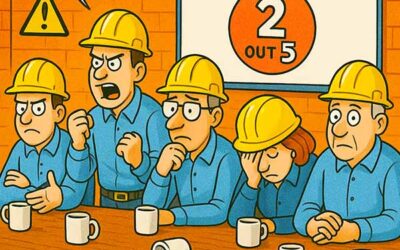
The problem compounds when maintenance teams get stuck in a reactive loop. Every premature failure generates another work order, another trip to the storeroom, another round of troubleshooting.
Technicians who should be executing planned work are instead chasing the same failures on repeat. Over the course of a year, a single bad part number can consume hundreds of labor hours and tens of thousands of dollars in lost output.
And that reactive loop has secondary costs. When technicians spend their days replacing the same parts, morale drops. When planners can’t stabilize a weekly schedule because unplanned work keeps crashing in, planned work completion rates suffer across the board.
The cheap part destabilized the entire maintenance operation.
How to Reduce Spare Parts Costs with Smarter Sourcing
Reducing spare parts costs requires moving the measurement point from purchase price to total cost of ownership. That shift changes which parts end up in the storeroom and which vendors stay on the approved list.
Start with your failure data. Pull the work order history for your highest-frequency replacements over the past 18 months. For each part, calculate:
- Total units consumed, including warranty replacements
- Total labor hours for each replacement event
- Downtime hours and estimated production loss per event
- Emergency freight charges for rush orders
- Administrative time spent re-ordering and expediting
This exercise usually reveals that 5% to 10% of your part numbers account for 40% or more of your total spare parts spending when measured by total cost. Those are the targets for sourcing improvement.
For those high-impact parts, request life-cycle cost data from vendors. Any reputable manufacturer can provide mean time between failure (MTBF) estimates for their products in similar operating environments.
Compare the annualized total cost of ownership, including installation labor and expected downtime, across brands. The differences will be stark.
When you can show that a $300 seal outperforms a $90 seal by a factor of four on annualized cost, the budget conversation shifts fast.
This data-driven approach also makes it easier to justify the upfront spend to procurement and finance. When you can show that a $300 seal outperforms a $90 seal by a factor of four on annualized cost, the conversation shifts from “why so expensive” to “why did we ever buy the cheap one.”
Build a Criticality-Based Sourcing Strategy
Every part in your storeroom deserves a sourcing strategy matched to its criticality. For parts on critical assets (the equipment whose failure stops production), quality and lead time should outweigh unit price. For consumables on non-critical assets, a lower-cost alternative might be perfectly acceptable.
Effective spare parts management starts with knowing which assets matter most and working backward to the parts that keep them running. A criticality ranking gives procurement the context it needs to make sourcing decisions that actually make operational sense.
- Critical spares: source from OEM or proven aftermarket suppliers with documented MTBF data and application-specific performance records
- Insurance spares: maintain minimum stock of OEM parts for catastrophic failure scenarios where lead time exceeds acceptable downtime
- Consumable spares: evaluate lower-cost alternatives where failure consequence is low and replacement is straightforward
This tiered approach to reducing spare parts costs prevents the blanket cost-cutting that hits critical equipment hardest. It also gives procurement clear guidelines instead of a single mandate to “find it cheaper.”
Preventing the Repeat Failure Trap
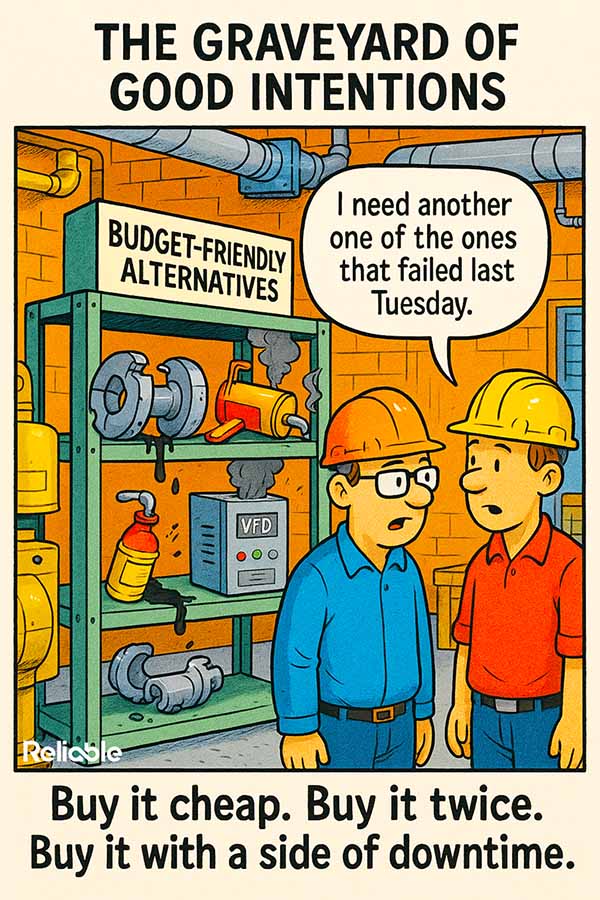
The most expensive spare part is the one you keep buying. Repeat failures signal either a parts quality problem, an installation problem, or a design problem. Without investigating which one, the default response is to reorder the same part and hope for a different result.
A structured root cause failure analysis on your top repeat failures will separate parts quality issues from installation or operating condition problems. Sometimes the cheap bearing fails because it’s a cheap bearing.
Sometimes it fails because the shaft is out of alignment and any bearing would fail in that environment. The fix is different in each case, and buying a more expensive part only solves one of them.
Track mean time between replacement for every critical spare. When a part’s actual MTBF falls below the manufacturer’s rated life by more than 25%, flag it for investigation. That gap is either a quality issue, an application mismatch, or an installation deficiency, and each one has a different corrective action.
The most expensive spare part is the one you keep buying. Repeat failures signal either a parts quality problem, an installation problem, or a design problem.
Pair this tracking with a formal parts qualification process. Before any new vendor’s part enters the storeroom for a critical application, require a trial period with documented performance data.
Two successful installations with MTBF at or above the incumbent part earns the new supplier a spot on the approved list. Anything less gets flagged and reviewed before the next purchase.
Stop Optimizing the Wrong Number
Plants that figure out how to reduce spare parts costs effectively share a common trait: they stopped measuring success by purchase price alone. Their KPIs shifted to annualized cost of ownership, mean time between replacement, and storeroom inventory turns.
Better maintenance planning also plays a role in reducing spare parts costs. Planned replacements let you batch orders, negotiate volume pricing, and avoid the 40% to 60% premium that comes with emergency freight. A well-planned job also reduces installation errors, which extends the life of the parts you’re installing.
Review your spend data quarterly. Look at the parts with the highest total cost of ownership, the highest replacement frequency, and the widest gap between rated and actual MTBF. Those three lists will overlap, and the parts on all three are your biggest opportunities to reduce spare parts costs.
The cheapest part is rarely the one with the lowest sticker price. It’s the one that stays in the machine the longest, causes the fewest disruptions, and lets your team focus on planned work instead of reactive firefighting. That’s the math worth optimizing.