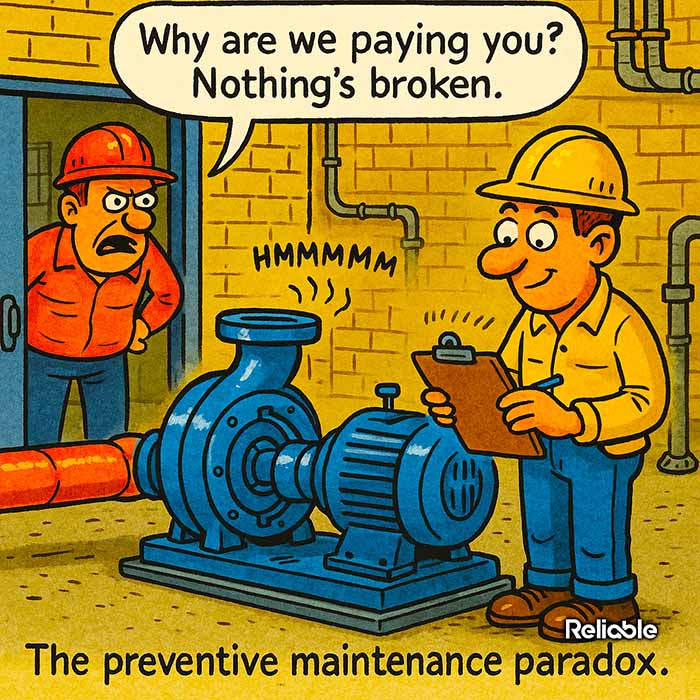

Preventive maintenance has a visibility problem. When the program works well, equipment runs, production stays on schedule, and nobody thinks twice about why. Then budget season arrives, and someone in a corner office looks at the maintenance line item and asks the inevitable question: why are we spending this much when nothing is breaking? Understanding how to justify preventive maintenance costs is one of the most important skills a maintenance leader can develop, because the better your program performs, the harder it becomes to defend.
This is the paradox that trips up maintenance managers every year. Success looks like nothing happening. And “nothing happening” is difficult to put on a slide.
But the numbers are there if you know where to find them, and presenting them the right way can turn a skeptical CFO into your biggest advocate.
The Visibility Gap: Why PM Programs Get Questioned
Reactive maintenance is loud. A bearing seizes at 2 a.m., the line goes down, a crew scrambles, parts get overnighted, and everyone from the plant manager to the shipping department knows about it. The cost is visible, painful, and memorable.
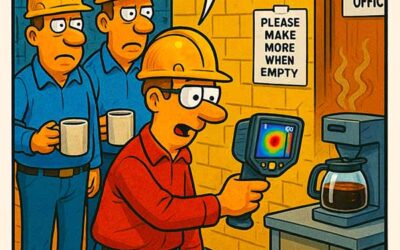
Preventive maintenance is quiet. A technician greases that same bearing on a Tuesday afternoon, logs the work order, and moves on. Nobody outside the maintenance shop notices. The avoided failure never shows up on a report because it never happened.
The best preventive maintenance programs produce the least visible results, and that is exactly why they are hard to defend at budget time.
This asymmetry creates a dangerous dynamic. When budgets tighten, the quiet line item gets scrutinized first. Leadership remembers the emergency repairs (because they were dramatic) but struggles to connect the current calm period to the PM work that made it possible.
Maintenance managers who wait for leadership to understand this on their own will wait a long time. The burden falls on you to build the case proactively.
How to Justify Preventive Maintenance Costs with Hard Numbers
Data survives budget reviews. Feelings and instincts do not. Here is where to find the numbers that matter.
Calculate the True Cost of Reactive Maintenance
Most organizations undercount the cost of unplanned repairs by 50% or more. They see the parts invoice and the overtime labor, but they miss the cascading costs:
- Lost production output during downtime (often the largest single cost, measured in revenue per hour of downtime)
- Expedited shipping premiums for emergency parts, typically 3x to 10x the standard shipping cost
- Collateral damage to adjacent components when a failure propagates through the system
- Quality defects produced during degraded operation in the hours or days before the failure was caught
- Administrative time spent on root cause investigations, incident reports, and rescheduling production
Add those up for your top 10 unplanned failures from the past 12 months. The total will surprise leadership, and it gives you a concrete comparison point: this is what we spent reacting, and this is what we spend preventing.
One pulp and paper mill ran this exercise and found their true reactive maintenance cost was $4.2 million annually, against a PM program budget of $1.1 million. The math spoke for itself.
When you compare the full cost of reactive repairs to the PM budget, the program stops looking like an expense and starts looking like insurance that pays for itself.
This comparison is the foundation of any business case. Get the numbers right, and the rest of the conversation gets much easier.
Track What Your PM Program Has Prevented
This is the hardest metric to quantify, but it is also the most persuasive. You need a way to show avoided failures, the events that would have happened without PM intervention.
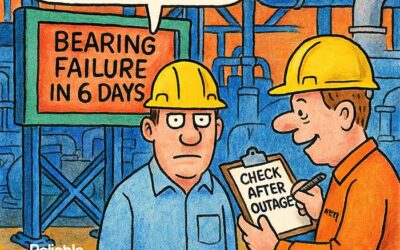
Start with your condition monitoring data. Every time a vibration reading, oil analysis result, or thermographic scan identified a developing problem that was corrected during a planned outage, that is an avoided failure. Log them. Assign an estimated cost based on similar historical failures.
Some ways to build this “save” log:
- Tag work orders where PM inspections discovered a condition that would have led to failure within 30 days
- Document cases where condition monitoring trends triggered early intervention
- Record instances where PM tasks identified loose connections, worn components, or fluid contamination before operational impact
Over 12 months, this log becomes a compelling record. It transforms the abstract value of prevention into a list of specific events with dollar amounts attached.
Framing the Business Case for Preventive Maintenance Costs
Numbers matter, but framing matters just as much. Maintenance managers often present their case in maintenance language (MTBF, wrench time, PM compliance) and wonder why finance glazes over. The key is translating maintenance outcomes into business outcomes.
Speak in Business Terms
Finance teams care about risk, return, and predictability. Your PM program delivers all three, but you have to say it that way.
- Risk reduction: “Our PM program reduced unplanned downtime by 34% last year, which lowered the probability of missing a major customer delivery from once per quarter to once per year.”
- Return on investment: “Every dollar spent on preventive maintenance avoided $3.80 in reactive repair costs, based on our tracked failure avoidance log.”
- Predictability: “PM scheduling lets us concentrate 78% of our maintenance labor during planned outages, keeping production interruptions predictable and manageable.”
These statements land differently than “PM compliance is at 92%.” Both describe the same program, but one speaks the language of the audience.
A cost avoidance ratio will carry a budget conversation further than any compliance percentage ever could.
If your maintenance team has been tracking the right data (and if you have followed the steps above, they have), these translations are straightforward. The hard part is remembering to make them.
Use the “What If We Stop” Scenario
Sometimes the most effective argument is the counterfactual. What would happen if we cut the PM budget by 30%? Walk leadership through the consequences, specifically and without exaggeration.
Pull the failure history for the equipment classes that would lose PM coverage. Show the mean time between failures for those assets before and after PM was implemented. Project the expected failure rate at the reduced coverage level.
Be precise. “We would expect 12 to 15 additional unplanned failures per quarter on our critical centrifugal pumps alone, based on pre-PM failure rates from 2019. Each failure averages 6 hours of downtime and $18,000 in combined repair and production loss costs.” That is a projected $216,000 to $270,000 per quarter in additional costs from a single equipment class.
This approach works because it is specific, falsifiable, and grounded in the plant’s own history. It gives leadership a clear picture of what the PM investment is holding at bay. And unlike abstract arguments about best practices, a counterfactual built on your own failure data is very difficult to dismiss.
Sustaining the Case Beyond Budget Season
Knowing how to justify preventive maintenance costs works best as a year-round practice. The best maintenance organizations build ongoing visibility into their PM program’s value through consistent, simple reporting.
Monthly reporting should include at least three metrics that leadership can understand without a maintenance engineering degree:
- Cost avoidance: total estimated savings from PM-identified issues, updated monthly
- Reactive vs. planned ratio: percentage of work orders that are unplanned, trending over time
- Downtime hours: total unplanned downtime, separated by equipment class
A monthly drumbeat of PM value reporting is easier to maintain than a from-scratch budget justification every year.
These numbers create a track record. When budget season comes around, you are pointing to 12 months of documented value instead of scrambling to assemble a retroactive justification.
Keep the reporting simple. One page, three charts, updated the same week each month. Consistency matters more than sophistication. And share the report broadly: operations managers, plant leadership, and finance should all see it. The more people who understand what PM delivers, the fewer surprised faces you will encounter at budget time.
The Long Game
The preventive maintenance paradox will never fully disappear. Success will always be quiet, and quiet will always invite scrutiny. That is the nature of prevention in any context: the avoided disaster is invisible by definition.
But maintenance leaders who build the habit of tracking, translating, and communicating their program’s value put themselves in a fundamentally stronger position. They walk into budget conversations with evidence, context, and a track record that speaks louder than any single presentation.
And in most organizations, that shift from defending a cost center to demonstrating a value driver is what separates maintenance programs that grow from the ones that get slowly starved.