Metrics
Pump Reliability and MTBF Statistics: Benchmarks, Failure Data, and Costs
Electrical Equipment Failure Rate Benchmarks and Their Limits
Unplanned Downtime Frequency Benchmarks: How Often It Happens
PM Compliance Rate Benchmarks: Is 90% the Right Target?
Spare Parts Inventory Carrying Cost Benchmarks Explained
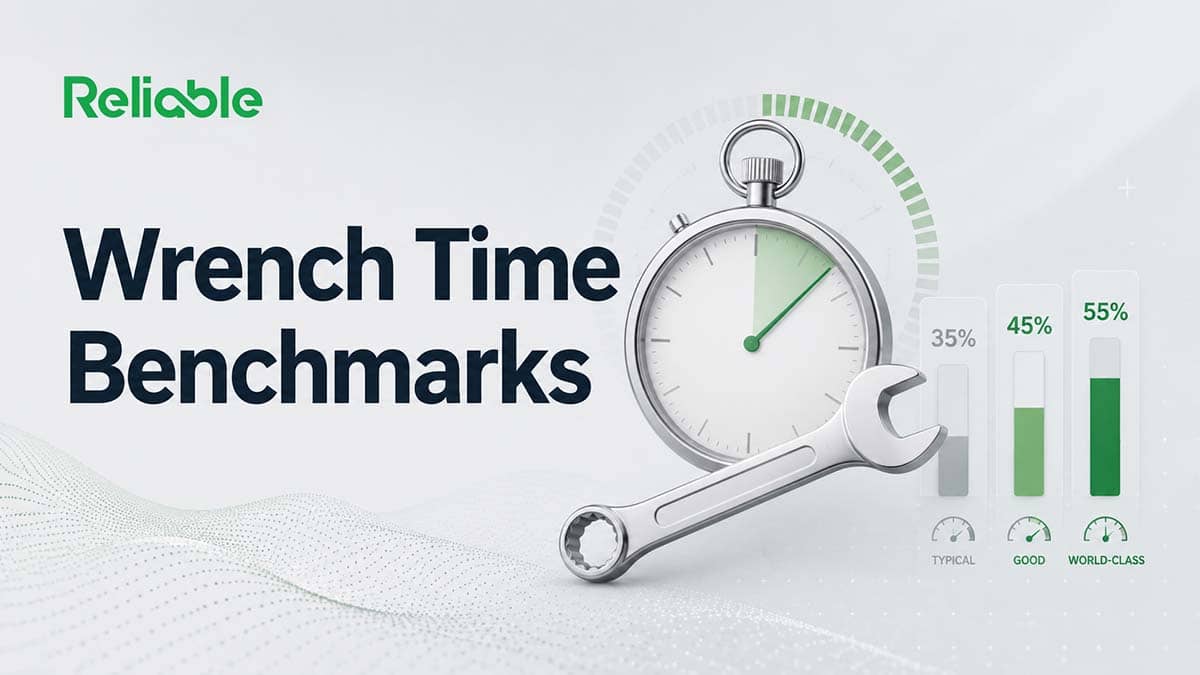
Wrench Time Benchmarks: Typical, Good, and World-Class Rates
MTBF and MTTR Benchmarks by Equipment Type: What Holds Up
Planned vs Reactive Maintenance Spend Ratios: Reality Check
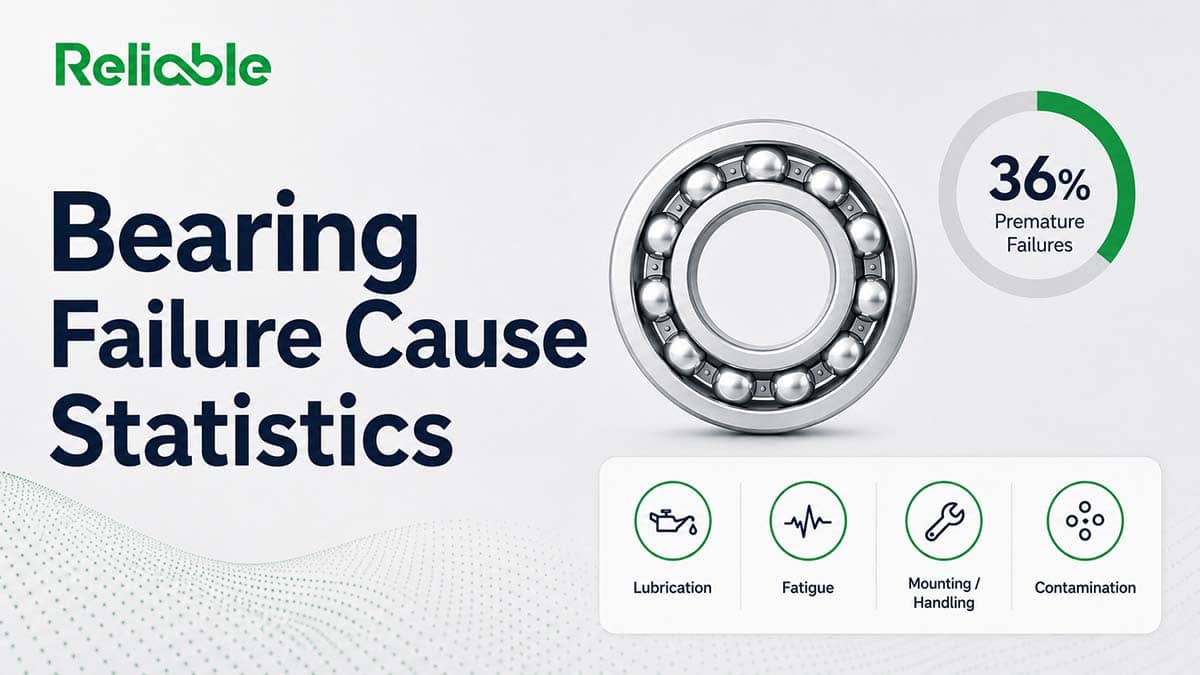
Bearing Failure Cause Statistics: What the Numbers Show
OEE Benchmarks by Industry: What World Class Really Means

Maintenance Cost as a Percent of RAV: Benchmarks by Industry
Predictive Maintenance ROI Benchmarks: What the Studies Show
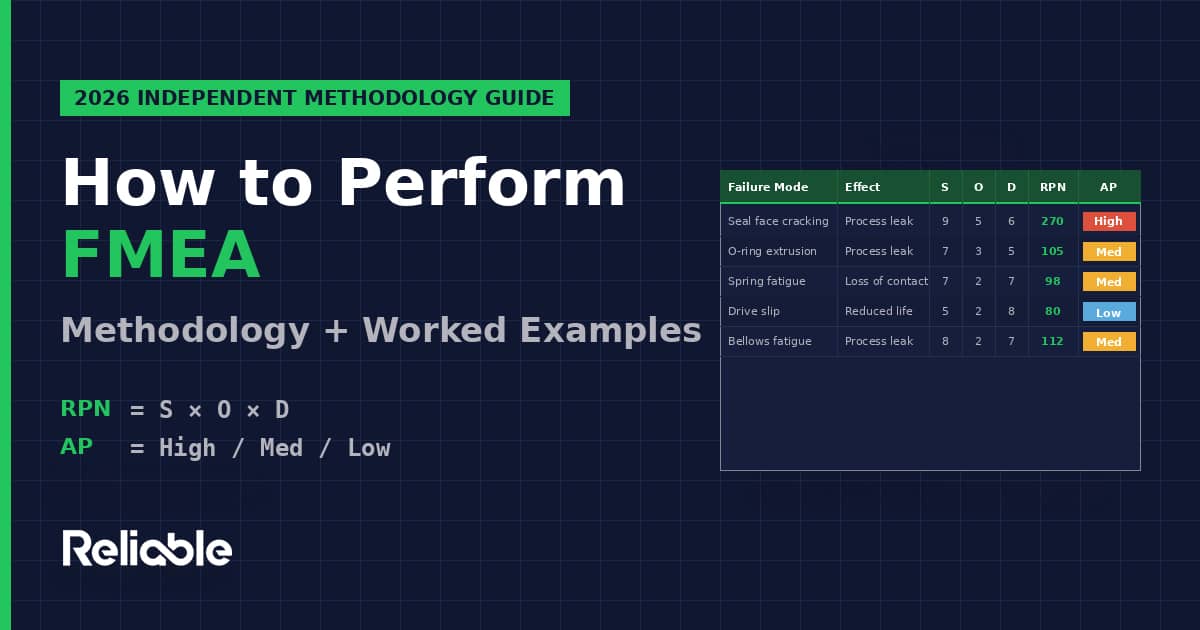
How to Perform FMEA: Methodology and Worked Examples
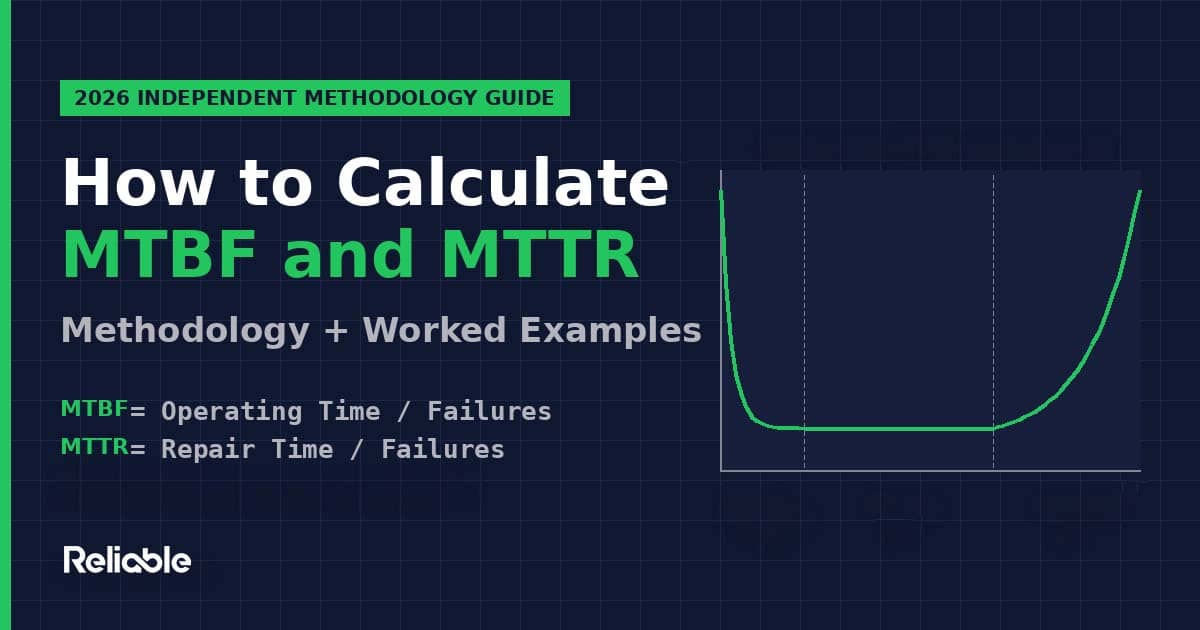
How to Calculate MTBF and MTTR: Methodology and Worked Examples
How to Measure and Improve Wrench Time Without Alienating Your Crews

What Is a P-F Curve? The Reliability Tool That Prevents Costly Failures
Maintenance KPIs That Actually Matter: 8 Metrics to Track in 2026
Seven Causes of Bad Work Order Data That Distort Maintenance Metrics
How to Use Difference-of-Means Analysis to Confirm Real KPI Gains
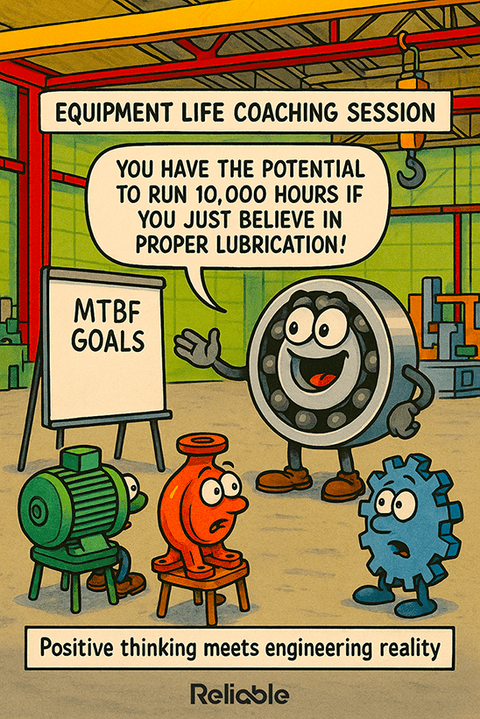
How to Improve MTBF in Reliability: The Key to Sustainable Uptime Gains
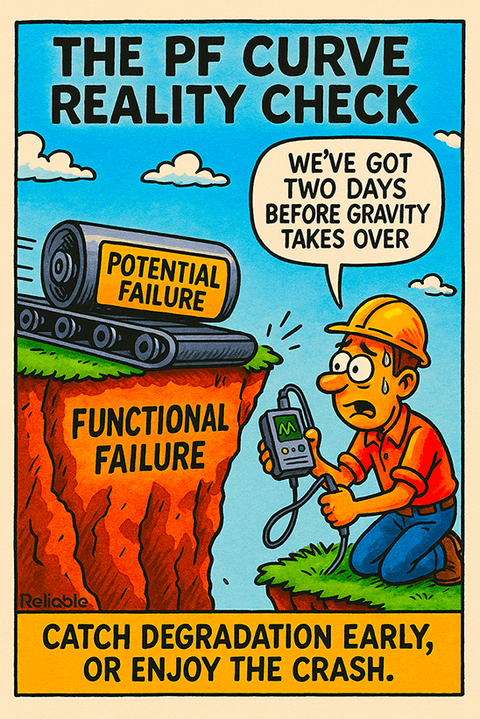
PF Curve Reality Check: Best Practices for Early Failure Detection
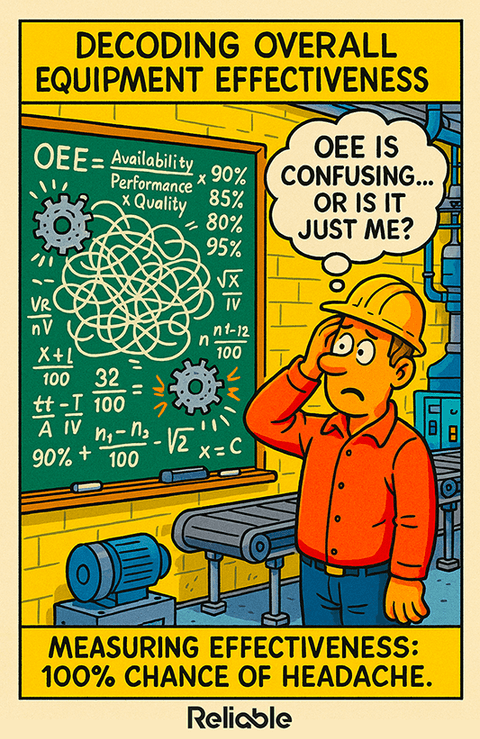
Decoding Overall Equipment Effectiveness: Simplifying OEE for Plant Success
Weibull Analysis Works Best When Failure Data Is Clean and Specific