How Machine Learning Can Estimate Wind Turbine Lubrication Conditions

A wind turbine can record a wealth of data about its own operation, yet most of it goes unused. More value can be drawn from it by combining it with classical methods. What if we tapped into data we hadn’t been using, drawing on the turbine’s own history to better understand component condition?
Many failures in the lubricated components of wind turbine gearboxes start with poor lubrication, which is currently checked only through oil analysis every 6 to 12 months. This article shows how to estimate the lubrication regime and combine it with a Machine Learning model to assess component condition and project future scenarios.
Why Wind Turbine Lubrication Needs Closer Monitoring
Wind turbine gearboxes are designed to last 20 years, but rarely do. When a gearbox fails, the cost isn’t just repair or replacement, it’s also the downtime and the lost energy production while the turbine is stopped. Most of these failures occur in the bearings, especially the high-speed shaft bearings, and poor lubrication is a common cause (Nicholas et al., 2021). Today, lubrication in this equipment is assessed every 6 to 12 months through oil analysis, which reports viscosity, contamination, and wear metals.
However, it tells us nothing about the lubrication regime or how oil properties fluctuate between samples. Viscosity changes constantly with temperature while the turbine runs under load, and not detecting when those changes happen keeps us from anticipating when a component is running poorly lubricated. This is where tribology comes in: the Stribeck curve and the elastohydrodynamic lubrication regime explain what lubrication depends on. We now add Machine Learning (ML) to the mix, able to learn from and analyze that data.
Tribological Fundamentals
Oil forms the film between bearing surfaces. Two main factors determine its thickness: speed and temperature, and they pull in opposite directions: speed increases film thickness by dragging more oil into the contact zone, while temperature decreases it by reducing the oil’s viscosity. For reference, a 10 °C rise can reduce film thickness by 20 to 30%.
With that in mind, we can start thinking about how much film is needed to keep the surfaces from touching. This is captured by the film thickness parameter, λ:

where h is the minimum lubricant film thickness and σ is the combined roughness of both surfaces. No surface is perfectly smooth, and λ tells us whether the film covers those microscopic peaks or not (Hart et al., 2022).
As a reference point, a 10 °C rise can reduce film thickness by 20 to 30%.
Depending on the value of λ, lubrication falls into one of three regimes (Figure 1). The first, boundary lubrication, occurs when λ < 1: the film is thinner than the asperities (microscopic peaks), which come into contact. This usually happens during turbine start-ups and shutdowns. The second, mixed lubrication, occurs when 1 ≤ λ ≤ 3: a partial film forms, with part of the load carried by the oil and part by the asperities in contact.
As speed increases or temperature drops, film thickness grows until it reaches the third regime, elastohydrodynamic lubrication (EHL), which occurs when λ > 3. Here there is no asperity contact, making it the ideal regime for normal operation. For bearings, an analogous indicator, κ (ISO 281), compares the oil’s actual viscosity to the viscosity the bearing requires; with κ the thresholds shift: boundary lubrication below 1, and full-film lubrication (equivalent to EHL) from 4 upward.
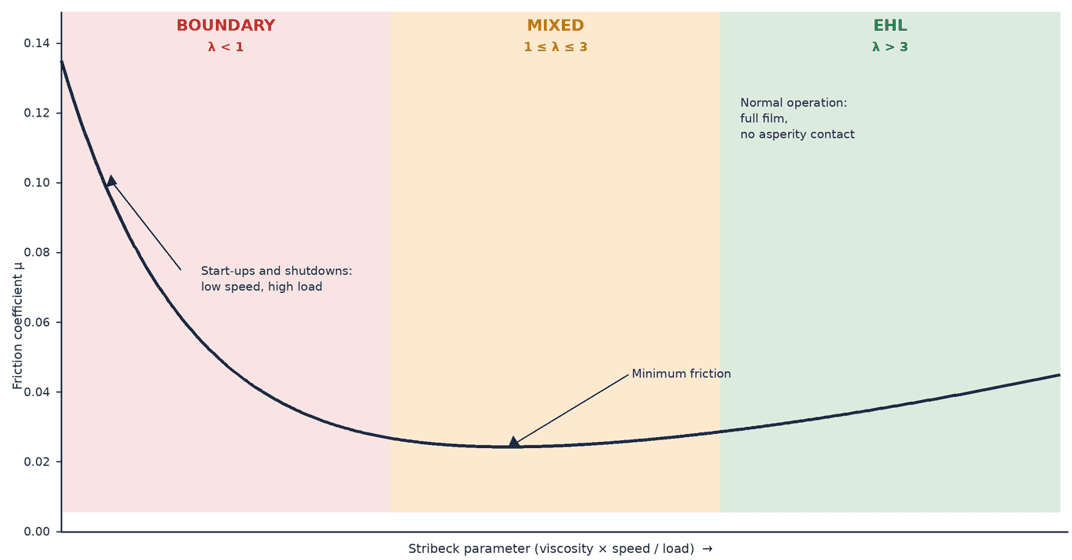
Load carries less weight than one might expect. More load does thin the film, but the effect is small: elastic deformation of the metal widens the contact zone, so pressure doesn’t rise in proportion to the load. For example, doubling the load barely reduces the film by 9%.
Classical formulas assume ideal operating conditions: clean oil at its nominal viscosity, constant speed and load, and known temperature and load at the contact point. A turbine meets none of these. Wind is constantly changing, with gusts, start-ups, and shutdowns, so speed and load are never constant. On top of that, SCADA reports 10-minute averages and doesn’t measure load directly, only power output. And as noted in the introduction, oil is only analyzed every 6 to 12 months, so between samples we don’t actually know its condition.
Hybrid Approach: Tribology and Machine Learning
The most direct way to learn from a turbine’s history is ML, but it isn’t enough on its own. Failures have different causes each time, and lubrication is almost never logged as the cause, so the model has very few examples to learn from. It would also work as a black box: we wouldn’t know how it reached its conclusion. Physics alone, as we saw, is imprecise under real conditions, and only accurate under ideal ones.
Physics and ML complement each other: physics supplies the variables and the explanation, and ML corrects its error using each turbine’s data.
The two complement each other: physics gives ML the relevant variables and a first estimate of λ. ML then takes that estimate and corrects it using each turbine’s real data. As a result, the model doesn’t need failure examples, since it learns from healthy machines and builds on the physics, and its results stay explainable and grounded in the Stribeck curve. This gets us estimates tailored to each turbine, without generalizing across the fleet.
A field study on the high-speed shaft bearing of a Vestas V42 (Nicholas et al., 2021) found that insufficient lubrication concentrated around start-ups and speed changes, at low speed. This matches what the physics predicts: at low speed, less oil is dragged into the contact zone, and the film thins out. That’s why the system flags these moments, such as start-ups, load changes, and cold starts, so they can be accounted for: physics points to where to look, although 10-minute data can’t capture events that last only a few minutes.
Features and Hybrid Model
Before analysis, we remove data that doesn’t reflect the turbine’s real operation, such as faulty or frozen sensors, data gaps, and maintenance periods. We then separate operating states, since the physics differs between standstill, start-up, and steady production, and mixing that data would confuse the model.
With these variables, we build a normal behavior model, a common approach in SCADA-based condition monitoring (Tautz-Weinert and Watson, 2017): learn how each component behaves when healthy, to detect when it stops behaving that way. Physics provides a first prediction of how much each component should heat up, and instead of predicting from scratch, ML learns only the error in that physics on healthy machines, with one model per turbine and component. We use ridge regression, a simple method that lets us see how much weight each variable carries.
Using the data the turbine already records, and without installing new sensors, a first estimate of the lubrication regime can be obtained, although it still needs to be validated against actual wear.
What’s left unexplained, the residual, is the signal we care about: if actual temperature persistently exceeds the expected value, it points to excess heating that may indicate added friction or other operating anomalies. Past certain thresholds, the system moves the component into watch, alert, or critical status, and each alert states which variables weighed most and what regime the component was in.

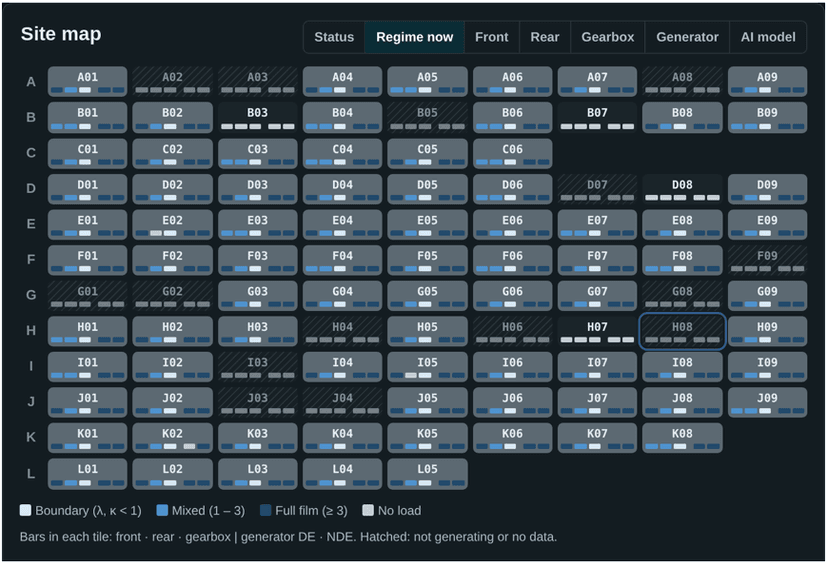
The system models the gearbox stages, the main bearings, and the generator bearings. Based on the physical estimate, using the gear geometry as sized, the gearbox’s first stage would sit in the boundary lubrication regime; the absolute value is approximate and is mainly useful for comparing machines and periods (Figure 3).
Conclusions
Using the data the turbine already records, and without installing new sensors, a first estimate of the lubrication regime can be obtained, although it still needs to be validated against actual wear.
Physics and ML complement each other: physics supplies the variables and the explanation, and ML corrects its error using each turbine’s data.
Temperature alone warns late, so it’s best combined with the Stribeck regime and lab analysis.
The methodology is implemented and in testing with real data, ahead of its final validation for industrial applications.
References
ASTM International (2020). ASTM D341-20: Standard Practice for Viscosity-Temperature Equations and Charts for Liquid Petroleum or Hydrocarbon Products. ASTM International.
Hart, E., de Mello, E., & Dwyer-Joyce, R. (2022). Wind turbine main-bearing lubrication, Part 1: An introductory review of elastohydrodynamic lubrication theory. Wind Energy Science, 7(3), 1021–1042. https://wes.copernicus.org/articles/7/1021/2022/
ISO (2007). ISO 281:2007, Rolling bearings: Dynamic load ratings and rating life. International Organization for Standardization.
Nicholas, G., Clarke, B. P., & Dwyer-Joyce, R. S. (2021). Detection of Lubrication State in a Field Operational Wind Turbine Gearbox Bearing Using Ultrasonic Reflectometry. Lubricants, 9(1), 6. https://www.mdpi.com/2075-4442/9/1/6
Tautz-Weinert, J., & Watson, S. J. (2017). Using SCADA data for wind turbine condition monitoring: a review. IET Renewable Power Generation, 11(4), 382–394. https://dspace.lboro.ac.uk/dspace-jspui/handle/2134/22713