How Modal Testing Guided a Fix for Excessive Dewatering Pump Vibration
During a vibration assessment of a newly installed hydroelectric turbine by the Machine Dynamics Group (MD), site personnel suspected high vibrations in the newly installed dewatering pump and requested MD's assistance to measure and assess the vibration severity. Vibrations at the top of the motor were close to 0.7 inches per second (IPS) RMS.
These levels are well above recommended standards and will damage the bearings and motor over time. MD suspected excitation of a structural natural frequency at the motor's running speed of 1200 RPM (20 Hz). An impact test on the motor confirmed that a structural natural frequency exists at 20 Hz, causing elevated vibration levels. This case study details the approach to identifying the structural natural frequency, the associated mode shapes, and the solution implemented to reduce vibrations to acceptable levels.
High Motor Vibration Prompts Further Investigation
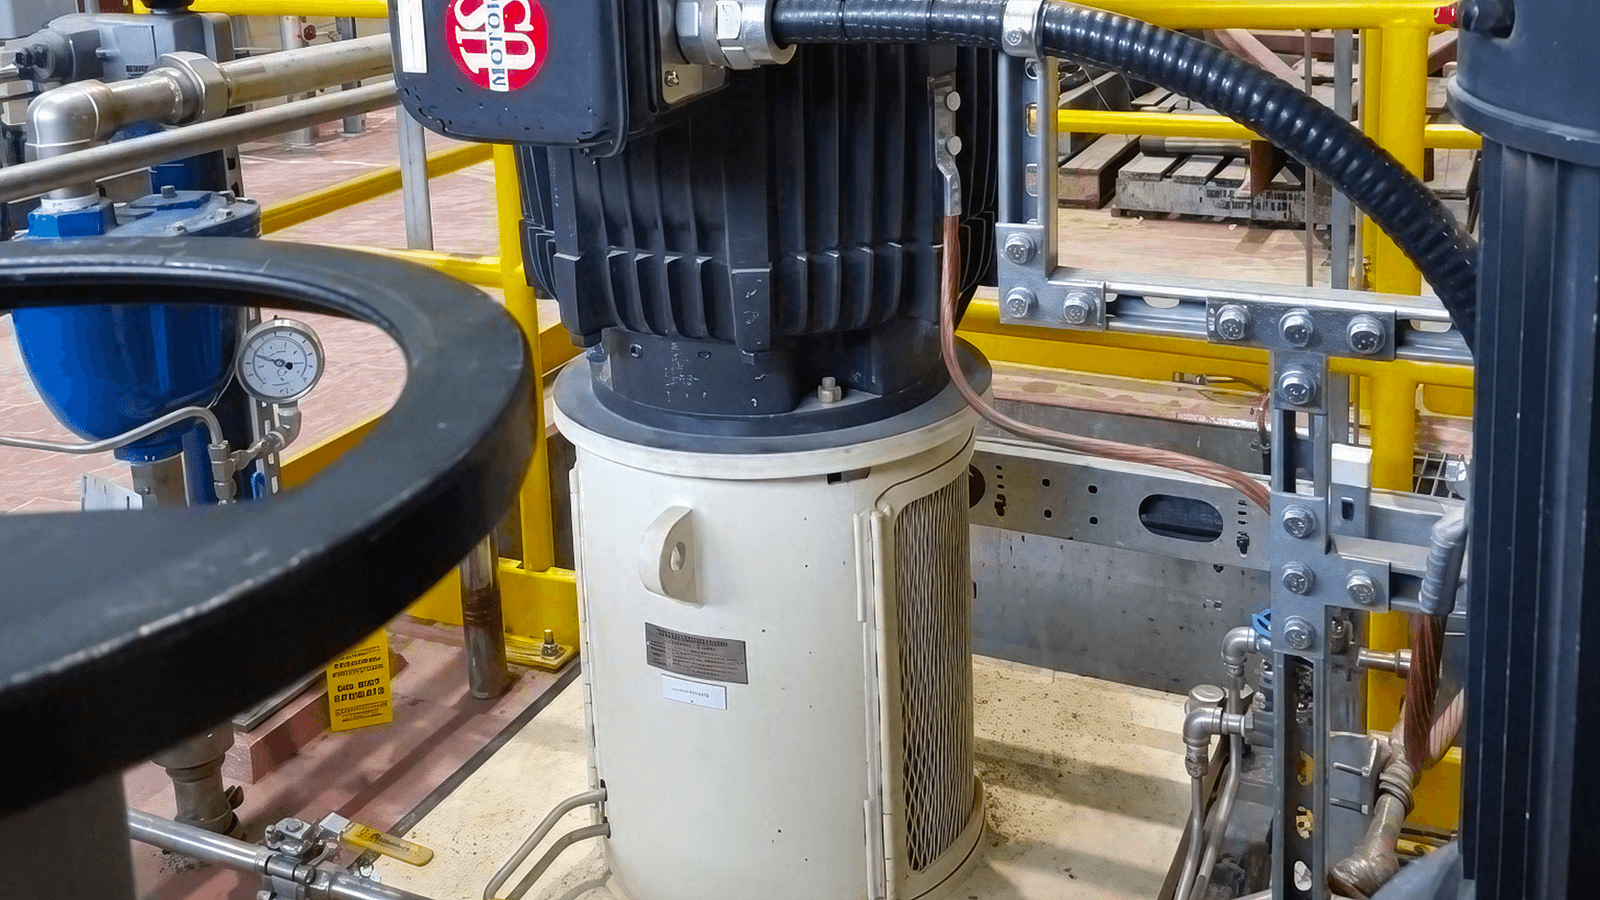
During vibration diagnostics of a newly installed hydro turbine, site personnel suspected that the motor for the newly installed dewatering pump (Figure 1) is experiencing high vibrations. Site personnel requested that MD measure and assess the vibration severity. The motor is rated at 90 kW with a synchronous speed of 1200 RPM.
Preliminary vibration measurements at the top of the motor indicated casing vibration levels close to 0.7 ips RMS. This level is considered excessive and well beyond any ISO or API standard limits. Operating the pump at these vibration levels may cause severe damage to the motor bearings as well as the pedestal.
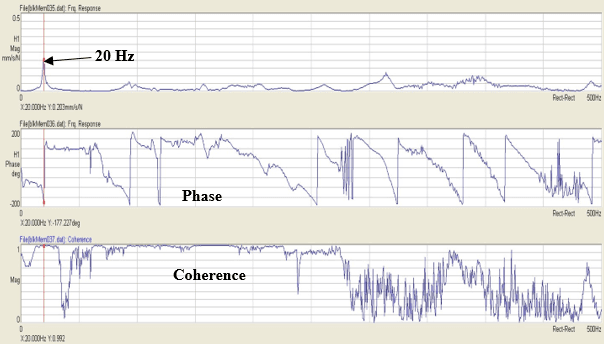
An impact test on the motor confirmed that a structural natural frequency exists at 20 Hz, causing elevated vibration levels.
MD suspects the elevated vibration levels are most likely due to a structural natural frequency close to the motor running speed. Additional measurements and impact tests are needed to confirm the cause of the high vibrations and develop a mitigation plan to reduce them to acceptable levels.
Measurements Reveal Vibration at Motor Running Speed
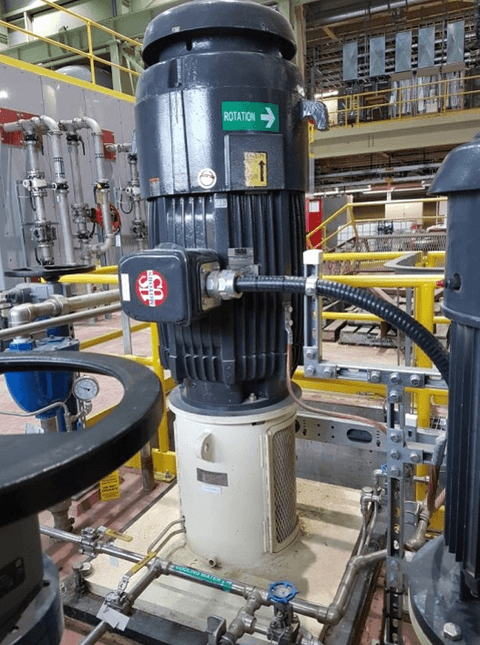
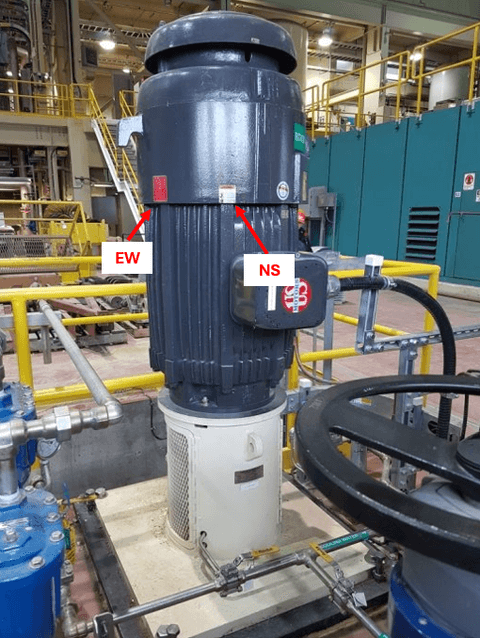
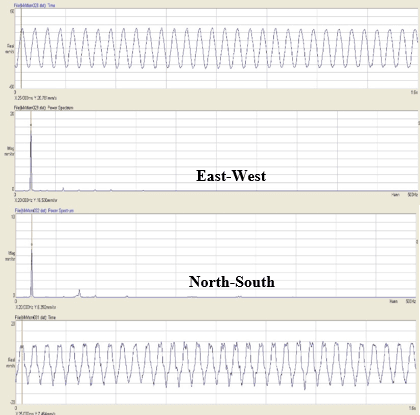
Measurements were taken at the top of the motor using a velometer in two radial directions, East-West (EW) and North-South (NS), as shown in Figure 2. The time waveforms and spectra of the measured locations are shown in Figure 3. Both time waveforms and spectra show that the dominant vibration component is 1x RPM (20 HZ) of the motor.
The spectra show vibration levels of about 0.65 ips RMS in the EW direction and 0.3 ips RMS in the NS direction. The difference in the vibration levels is most likely because the support structure is stiffer in the NS direction than in the EW direction.
ISO 10816-3 states that for newly installed pumps, acceptable vibration levels should not exceed 0.07 IPS RMS; the measured values are well above this limit. Based on the time waveforms and spectra, the author suspected a structural natural frequency near 20 Hz that is being excited by the motor speed.
Impact Testing Confirms Structural Resonance
An impact test at the top of the motor was conducted to identify any structural natural frequencies close to any forcing frequencies. Impact tests are performed by a hammer with an instrumented load cell and a velometer/accelerometer mounted at the structure being impacted; the response is recorded on an analyzer.
Figure 4 shows the response at the top of the motor in the EW direction. The FRF (Frequency Response Function) shows a frequency at 20 Hz with a phase shift of about 180o and a coherence of 92%. This confirms that the natural frequency of the motor/pump structure is being excited by the speed of the motor. To reduce the vibration levels, one would need to shift the natural frequency, either by increasing the stiffness of the structure or installing a dynamic absorber.
Modal Analysis Identifies the Structural Mode Shape
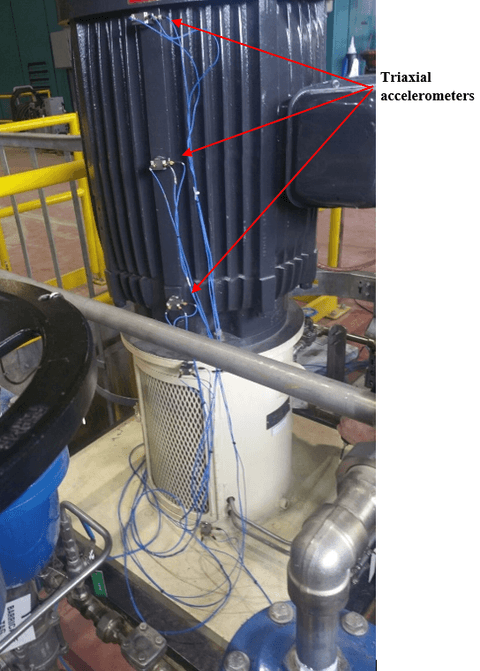
Having confirmed that the cause of the high vibrations is the structural natural frequency, the next step was to perform a modal analysis to identify the mode shape associated with the 20 Hz natural frequency. Modal analysis is done by impacting the motor at the same location (usually at the top of the motor with the highest deflection) and roving the accelerometers to map the motor/pump structure, as shown in Figure 5.
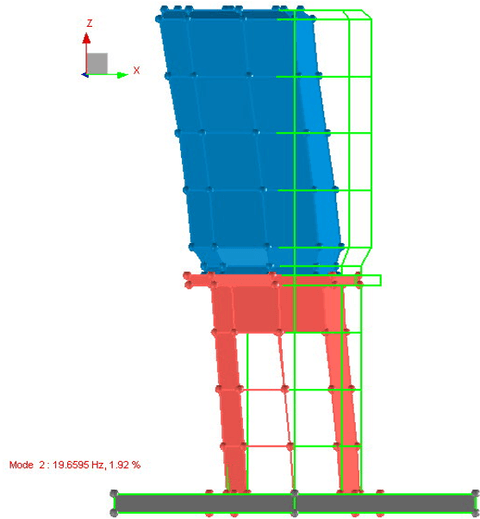
After completing the modal testing, the FRFs are entered into a model and animated to identify the mode shape associated with the 20 Hz (Figure 6). Figure 6 indicates that the 20 Hz is the first cantilever mode of the motor-pedestal. The decision was made to stiffen the structure to shift the 20 Hz natural frequency by at least 10% from the motor's rotational speed.
A Stiffer Pedestal Shifts the Natural Frequency
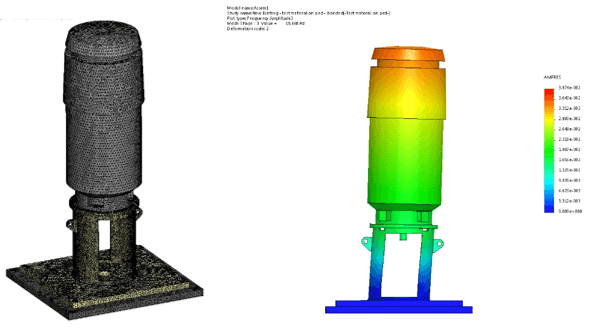
To investigate how to stiffen the structure, a finite element analysis (FEA) model was done (Figure 7). Simulation of the FEA model yielded a structural natural frequency of 19.7 Hz; this is very close to the 20 Hz measured in the field.
The vibration spectrum at the top of the motor shows that the 1x RPM (20 Hz) vibration component level is about 0.05 IPS.
The ideal place to stiffen the structure would be the top of the motor. However, this is not practical, as there is no on-site provision to anchor the stiffeners to a nearby wall.
The decision was made to modify the pedestal by adding stiffeners; the FEA model was updated to include the stiffeners as shown in Figure 8. The simulated model identified that the first natural frequency would be about 27 Hz.
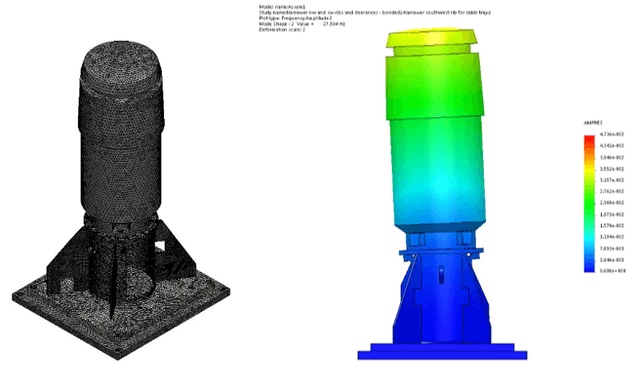
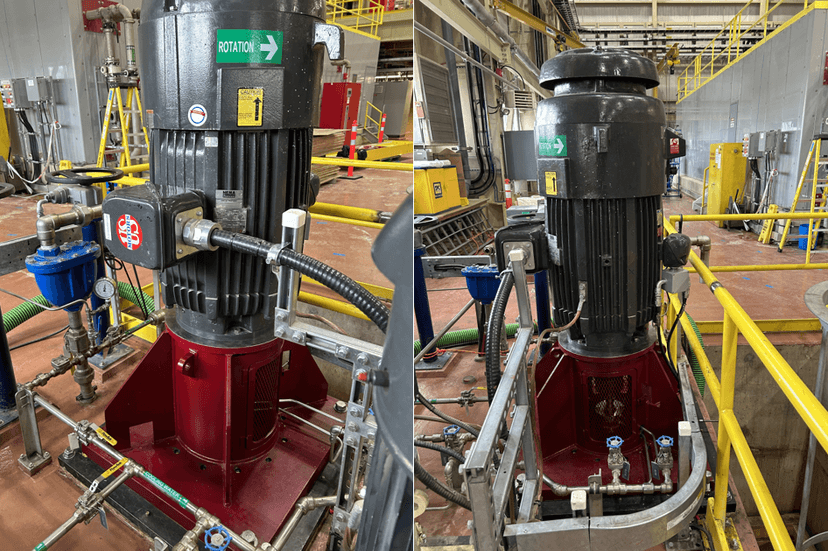
The decision was made to manufacture and install the new pedestal as shown in Figure 9.
Testing Verifies the Modified Pedestal and Lower Vibration
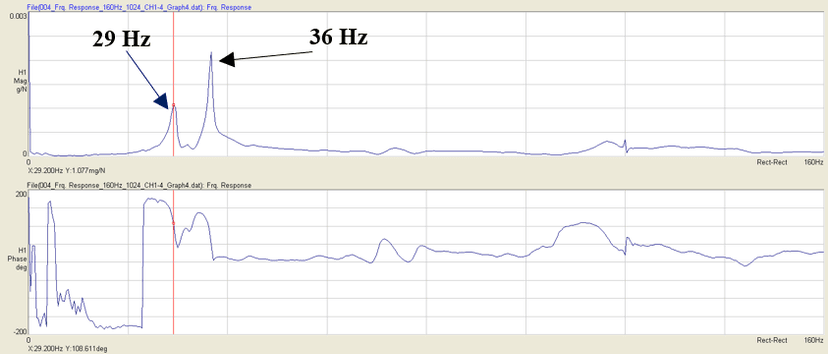
An impact test on the modified pump-motor structure identified the first natural frequency at 29 Hz and the second at 36 Hz, as shown in Figure 10; both are well separated from the 20 Hz forcing frequency. The actual first natural frequency was very close to the FEA predicted one of 27 Hz.
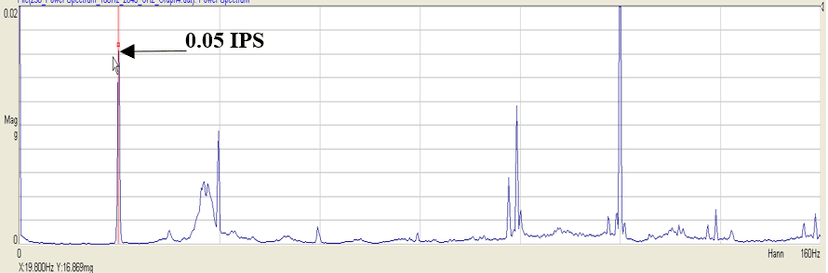
The vibration spectrum at the top of the motor shows that the 1x RPM (20 Hz) vibration component level is about 0.05 IPS. This is a significant improvement from the 0.7 IPS recorded prior to the modification. The overall levels are now below the ISO 10816-3 recommendations.
Testing and Specification Lessons for Vertical Pumps
Vertical pumps are inherently prone to having their first structural natural frequency close to the running speed of the motor. It is highly recommended that vibration testing be done on the motor/pump set at the factory and in situ, and impact tests be performed to confirm that structural natural frequencies are at least 15% removed from any forcing frequencies. The previous statement should also be included in the pump specifications. If this problem is not tackled early, it will lead to on-site complications and major design changes, as noted in this case study.