
Last updated: July 2026 | By the editors at Reliable
TL;DR: Heat exchanger fouling is one of the most expensive chronic problems in industry, with total cost penalties estimated at roughly 0.25 percent of the GDP of industrialized countries. The figure is based on national studies conducted in the 1980s and 1990s and is repeated throughout the fouling research literature, including reviews by Müller-Steinhagen, Malayeri, and Watkinson in Heat Transfer Engineering; a comparable modern study has yet to displace it in that literature. Fouling-related energy waste is estimated in that same literature at 1 to 2.5 percent of global CO2 emissions. In refining, the US Department of Energy has stated that fouling cost penalties are believed to exceed $2 billion per year in US refineries, and crude preheat train fouling specifically was estimated at about $1.2 billion per year circa 1992, before CO2 costs. One 200,000 barrel-per-day UK refinery reported that each 1°C of lost preheat cost it roughly £250,000 per year. The costs break into four buckets: oversized equipment bought to compensate for expected fouling, extra fuel and pumping energy, cleaning and maintenance, and lost production during outages.
Fouling Cost Statistics at a Glance
| Statistic | Figure | Source |
|---|---|---|
| Total fouling cost, industrialized countries | Roughly 0.25% of GDP, based on older national studies and repeated in the fouling research literature | Müller-Steinhagen, Malayeri, and Watkinson, Heat Transfer Engineering (2009, 2011) |
| Share of global CO2 emissions attributed to fouling | Estimated at 1 to 2.5% in the fouling research literature | Müller-Steinhagen et al.; Heat Exchanger Fouling and Cleaning conference series |
| US refinery fouling cost | Believed to exceed $2 billion per year | US DOE Industrial Technologies Program, Fouling Minimization project fact sheet (Argonne National Laboratory) |
| US crude preheat train fouling cost | About $1.2 billion per year circa 1992, before CO2 costs | Macchietto et al., Fouling in Crude Oil Preheat Trains |
| Value of 1°C of lost preheat | One 200,000 bbl/day UK refinery reported about £250,000 per year per 1°C loss (April 2009) | Macchietto et al. (2011) |
| CO2 attributed to refinery fouling worldwide | About 88 million tons per year, assuming roughly 750 refineries worldwide | Attributed to Müller-Steinhagen et al. (2009) in the fouling literature |
| First comprehensive US fouling cost study | 1985, DOE-funded | Garrett-Price et al., Fouling of Heat Exchangers (Noyes Publications, 1985) |
The major figures on this page are traced to the research literature or government sources. Where the original source is unclear or a figure travels through secondary citation, that limitation is stated rather than hidden.
The Headline Number: 0.25 Percent of GDP
The most cited figure in fouling economics is that deposit formation on heat transfer surfaces costs industrialized countries about 0.25 percent of GDP. It appears in editorials and review papers by Hans Müller-Steinhagen, M. Reza Malayeri, and A. Paul Watkinson in Heat Transfer Engineering, including the 2009 editorial “Heat Exchanger Fouling: Environmental Impacts” (vol. 30, pp. 773 to 776) and the 2011 review “Heat Exchanger Fouling: Mitigation and Cleaning Strategies” (vol. 32, pp. 189 to 196).
Two things about this number matter to anyone citing it.
First, it is a compilation, not a single measurement. The 0.25 percent figure aggregates national cost studies performed in different countries during the 1980s and 1990s, including the DOE-funded US work of the mid 1980s (see below) and a New Zealand national study by Steinhagen, Müller-Steinhagen, and Maani, published in Heat Transfer Engineering in 1993 and based on a survey of 200 companies operating nearly 2,000 heat exchangers. Applied to current US GDP (roughly $32.4 trillion nominal in 2026, per IMF estimates), 0.25 percent implies a cost on the order of $80 billion per year for the United States alone, but that extrapolation carries all the assumptions of 30-to-40-year-old fieldwork forward.
Second, it remains the reference figure in the fouling literature, where a comparable modern national study has yet to displace it. The fouling research community itself, through the biennial Heat Exchanger Fouling and Cleaning conference series, continues to describe the 0.25 percent figure as a conservative estimate from studies of that era. Some vendor materials present it as a current measured value. It is not. It is the best available estimate, and it is old.
The 1985 DOE Study: Where US Fouling Cost Data Began
The first comprehensive attempt to quantify US fouling costs was Fouling of Heat Exchangers: Characteristics, Costs, Prevention, Control, and Removal by Garrett-Price, Smith, Watts, and Knudsen (Noyes Publications, 1985), based on work at Pacific Northwest Laboratory for the US Department of Energy.
A follow-on 1988 conference paper by Rebello, Richlen, and Childs, “The Cost of Heat Exchanger Fouling in the US Industries,” analyzed fouling costs across four sectors: chemical, petroleum, electric utility, and other industries. It reported that 1982 US sales of industrial heat exchangers (excluding boilers and automotive radiators) ran to about 285,000 units and roughly $1.6 billion, put total US industrial heat exchanger duty at about 11.7 quads, estimated fouling-related lost energy at about 2.9 quads, and valued the extra heat transfer surface area purchased to compensate for fouling at about $180 million per year.
Totals reproduced from this era of US work vary between sources, which is one reason this page quotes the component figures the paper itself reports rather than a single headline dollar total.
The study framework remains the standard way fouling costs are decomposed, covered in the next section.
Where the Money Goes: The Four Cost Categories
Fouling cost studies consistently break the total into four categories.
1. Capital cost of overdesign. Designers compensate for anticipated fouling by adding surface area, specified through fouling factors such as those published by the Tubular Exchanger Manufacturers Association (TEMA). The added area, larger shells, stronger foundations, and extra installation cost are all fouling costs paid before the exchanger transfers a single watt. The Heat Exchanger Fouling and Cleaning conference literature notes that overdesign allowances reach up to 200 percent in some cases. Researchers at Imperial College London have noted that TEMA fouling factors are lumped, steady-state, heuristic values that neglect the local dynamics of deposit formation, which is one reason overdesign often fails to deliver the intended operating margin.
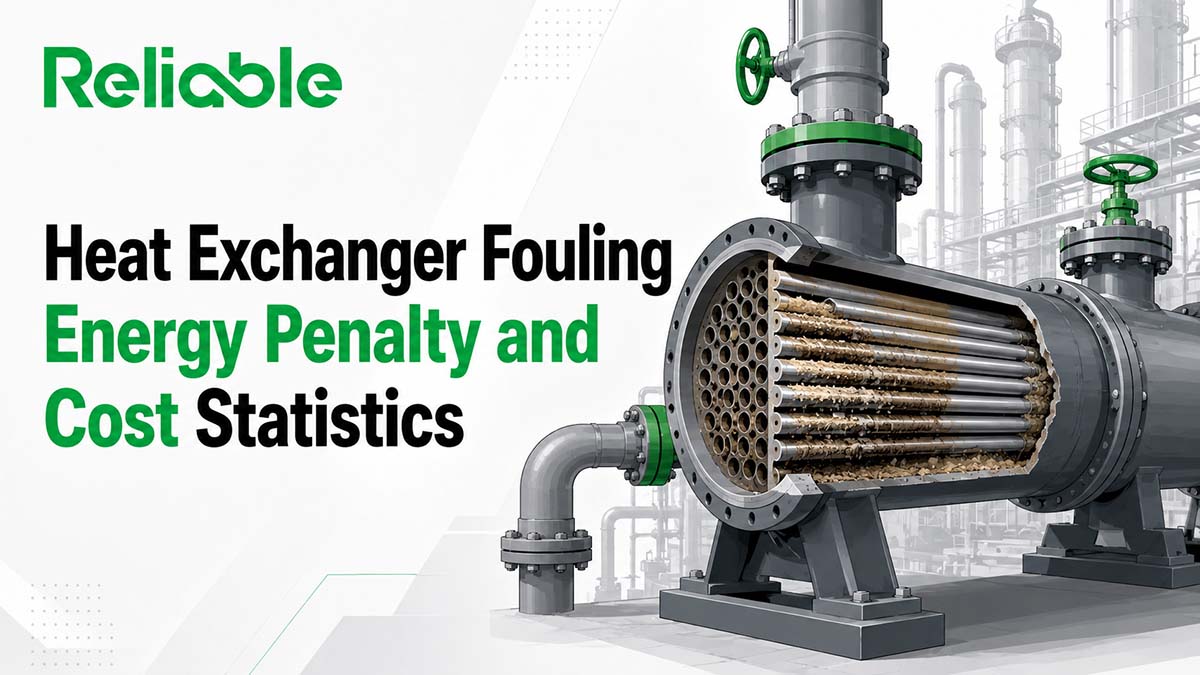
2. Additional energy consumption. A fouling layer is thermal insulation in exactly the place insulation is not wanted. As deposits accumulate, less heat transfers per unit area, and the process compensates by burning more fuel (in fired heaters downstream of preheat exchangers) or consuming more utility duty. Narrowed flow passages also raise pressure drop, increasing pumping power. This is typically the largest ongoing cost component in energy-intensive processes.
3. Maintenance and cleaning. Chemical cleaning, hydroblasting, mechanical tube cleaning, and the labor, permits, and waste disposal that go with them. Cleaning-in-place systems, antifoulant chemical programs, and online tube cleaning systems are all recurring spend that exists only because of fouling.
4. Production losses. Exchangers pulled for cleaning either force a unit outage or force throughput reductions while the unit runs with degraded heat recovery. In a refinery preheat train network modeled by Coletti and Macchietto, lost production grew to become the largest single fouling penalty, reaching about $20 million after one year of operation in that case study. The result is case specific, but it illustrates how production effects can overtake energy costs in continuous processes.
The Energy Penalty: How Fouling Converts to Fuel
The mechanism is straightforward. Overall heat transfer coefficient falls as deposit resistance accumulates, so the exchanger delivers less duty at the same temperature difference. In a crude distillation unit, the preheat train recovers heat from product and pumparound streams to raise crude temperature before the fired heater. Every degree the preheat train fails to deliver is a degree the furnace must supply by burning fuel.
That is what makes the preheat figure reported by Macchietto et al. (2011) so useful for anyone building an energy business case: a 200,000 barrel-per-day UK refinery reported to the authors in April 2009 that each 1°C loss in preheat cost it roughly £250,000 per year. That is a single site’s number, not a universal refinery average, but fouling losses of 10°C or more between cleanings are routinely reported in the crude fouling literature, which is how single-site fouling penalties reach into the millions of dollars per year.
At national scale, two figures anchor the US refining picture. Crude oil fouling in refinery preheat trains was estimated at about $1.2 billion per year circa 1992, before extra CO2 costs were included, as reported in Macchietto et al. For refinery fouling more broadly, the US Department of Energy’s Industrial Technologies Program stated that the cost penalty of fouling is believed to be in excess of $2 billion per year in US refineries alone, in the fact sheet for its Argonne National Laboratory fouling minimization project. The two numbers describe different scopes and eras and should not be presented as a trend line.
Fouling and CO2: 1 to 2.5 Percent of Global Emissions
Because fouling’s dominant ongoing cost is wasted fuel, it has a direct emissions signature. The fouling research community’s standard estimate, repeated across the Heat Exchanger Fouling and Cleaning conference series and the Müller-Steinhagen review papers, is that heat exchanger fouling accounts for 1 to 2.5 percent of global CO2 emissions.
Within refining specifically, the literature attributes about 88 million tons of CO2 per year worldwide to fouling, a figure citing Müller-Steinhagen et al. (2009) and based on an assumption of roughly 750 refineries operating worldwide. It is a reported attribution rather than a measured inventory.
For energy-efficiency and decarbonization programs, this makes fouling mitigation one of the rare efficiency measures where the emissions math is already published: cleaning a fouled exchanger network buys back fuel that is currently being burned to push heat through an insulating deposit layer.
Why Fouling Cost Estimates Vary So Much
Anyone comparing fouling cost figures across sources will find totals that differ by an order of magnitude. The variance has identifiable causes.
The base studies are old. The national cost studies underlying the 0.25 percent of GDP figure date to the 1980s and 1990s. Energy prices, plant populations, and crude slates have all changed since.
Cost category boundaries differ. Some studies count only energy and cleaning. Others include overdesign capital and lost production, which can multiply the total.
Fouling is process specific. Crude oil fouling in a refinery preheat train, cooling water scaling in a condenser, milk protein deposition in a dairy pasteurizer, and ash deposition in a coal-fired boiler are different mechanisms with different costs. Seawater cooling fouling has its own dedicated literature (Pugh, Hewitt, and Müller-Steinhagen, 2005). A single “cost of fouling” number averages across all of them.
Heavier feeds foul faster. In refining, the shift toward heavier, higher-asphaltene crudes has been documented as a driver of worsening preheat train fouling, which pushes real-world costs above what older studies captured.
The honest way to use these statistics is the way the researchers themselves present them: as order-of-magnitude evidence that fouling is a first-rank industrial cost, not as precise current measurements.
What This Means for Maintenance and Reliability Programs
Three practical implications fall out of the data.
Fouling is an energy program, not just a cleaning chore. The largest recurring cost is fuel, so exchanger cleaning schedules belong in the energy management conversation, not only the maintenance backlog. Monitoring approaches that track heat transfer coefficient or coil inlet temperature convert fouling from an invisible drift into a measurable loss with a dollar rate.
Cleaning schedule optimization has published ROI. The Imperial College and related research programs exist because moving from time-based to condition-based exchanger cleaning demonstrably recovers energy. The refinery literature includes network models built specifically to schedule cleanings against the fuel penalty of running fouled.
Overdesign is not mitigation. Adding TEMA-factor surface area raises capital cost and, in some services, makes fouling worse by lowering velocities. The research consensus is that fouling factors are design allowances, not a fouling management strategy. For definitions of related reliability terms, see our Maintenance and Reliability Glossary.
Frequently Asked Questions
How much does heat exchanger fouling cost industry?
The standard estimate is that fouling costs industrialized countries roughly 0.25 percent of GDP, based on national studies conducted in the 1980s and 1990s and repeated throughout the fouling research literature, including reviews by Müller-Steinhagen, Malayeri, and Watkinson in Heat Transfer Engineering. The costs include oversized equipment, additional fuel and pumping energy, cleaning and maintenance, and lost production. A comparable modern study has yet to displace this estimate in the fouling literature.
How much energy does fouling waste?
Fouling deposits act as insulation on heat transfer surfaces, forcing processes to burn additional fuel to achieve the same heating duty. The fouling research literature estimates that heat exchanger fouling accounts for 1 to 2.5 percent of global CO2 emissions. As a site-level example, one 200,000 barrel-per-day UK refinery reported that each 1°C of lost preheat cost it roughly £250,000 per year.
What does fouling cost refineries specifically?
The US Department of Energy has stated that fouling cost penalties are believed to exceed $2 billion per year in US refineries. Crude preheat train fouling specifically was estimated at about $1.2 billion per year circa 1992, before CO2 costs. Costs come from extra furnace fuel, throughput reductions, cleaning outages, and hydraulic problems as deposits accumulate.
What are the four cost categories of fouling?
Cost studies consistently decompose fouling costs into capital costs of overdesigned equipment purchased to compensate for expected fouling, additional energy consumption from degraded heat transfer and increased pressure drop, cleaning and maintenance costs, and production losses during cleaning outages or reduced-rate operation. In one modeled refinery preheat train network, lost production grew to become the largest single penalty within a year.
Is the 0.25 percent of GDP fouling statistic still accurate?
The figure comes from national cost studies performed in the 1980s and 1990s and remains the standard reference in the fouling literature, where a comparable study has yet to displace it. The underlying physics is unchanged and the fouling research community continues to treat it as a conservative order-of-magnitude estimate. It should be cited as a compiled historical estimate rather than a current measured value.
How is fouling accounted for in heat exchanger design?
Designers apply fouling factors, most commonly the values published by the Tubular Exchanger Manufacturers Association (TEMA), which add thermal resistance margin and therefore surface area to the design. The fouling research literature reports overdesign allowances reaching up to 200 percent in some cases, and researchers note these factors are lumped, steady-state heuristic values that neglect local fouling dynamics. Overdesign adds capital cost without managing fouling in operation.
Sources
- Müller-Steinhagen, H., Malayeri, M. R., and Watkinson, A. P., “Heat Exchanger Fouling: Environmental Impacts,” Heat Transfer Engineering, vol. 30 (2009), pp. 773 to 776
- Müller-Steinhagen, H., Malayeri, M. R., and Watkinson, A. P., “Heat Exchanger Fouling: Mitigation and Cleaning Strategies,” Heat Transfer Engineering, vol. 32 (2011), pp. 189 to 196
- Garrett-Price, B. A., Smith, S. A., Watts, R. L., and Knudsen, J. G., Fouling of Heat Exchangers: Characteristics, Costs, Prevention, Control, and Removal, Noyes Publications, 1985 (DOE/Pacific Northwest Laboratory)
- Rebello, W. J., Richlen, S. L., and Childs, F., “The Cost of Heat Exchanger Fouling in the US Industries,” conference paper, 1988 (OSTI)
- US Department of Energy, Industrial Technologies Program, “Fouling Minimization,” petroleum refining project fact sheet (Argonne National Laboratory), energy.gov
- Macchietto, S., et al., “Fouling in Crude Oil Preheat Trains: A Systematic Solution to an Old Problem,” Heat Exchanger Fouling and Cleaning conference proceedings, 2009/2011
- Coletti, F., and Macchietto, S., “Refinery Pre-Heat Train Network Simulation Undergoing Fouling: Assessment of Energy Efficiency and Carbon Emissions,” Heat Transfer Engineering, vol. 32 (2011), pp. 228 to 236
- Coletti, F., and Macchietto, S., “A Dynamic, Distributed Model of Shell-and-Tube Heat Exchangers Undergoing Crude Oil Fouling,” Industrial and Engineering Chemistry Research, 2010
- Steinhagen, R., Müller-Steinhagen, H., and Maani, K., “Problems and Costs Due to Heat Exchanger Fouling in New Zealand Industries,” Heat Transfer Engineering, vol. 14, no. 1 (1993), pp. 19 to 30
- Pugh, S. J., Hewitt, G. F., and Müller-Steinhagen, H., “Fouling During the Use of Seawater as Coolant: The Development of a User Guide,” Heat Transfer Engineering, vol. 26 (2005), pp. 35 to 43
- Heat Exchanger Fouling and Cleaning conference series (heatexchanger-fouling.com), refereed proceedings, 2013 and 2019 prefaces
- TEMA, Standards of the Tubular Exchanger Manufacturers Association