
Seeing the Invisible: The Power of Infrared Thermography
In maintenance, failure rarely begins with noise or smoke. It starts with heat. Infrared thermography condition monitoring exposes those invisible temperature patterns long before they turn into costly downtime. By transforming infrared radiation into visible thermal images, it helps maintenance teams detect subtle changes that human senses can’t perceive.
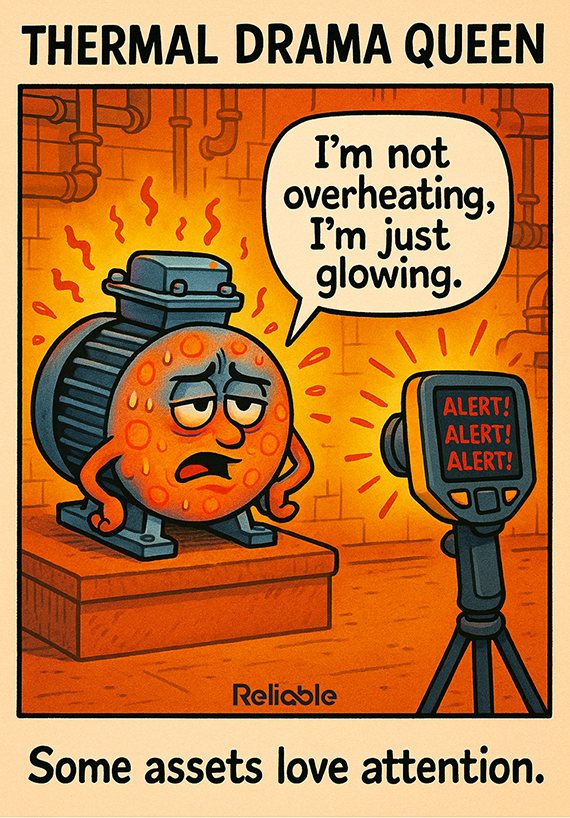
Every asset emits a thermal signature. When that signature shifts — whether due to friction, electrical resistance, or insulation breakdown — it signals a deviation from regular operation. These deviations are often early warnings of pending failure. Thermal cameras reveal them in seconds.
Every failure leaves a thermal fingerprint long before it leaves a mark on production.
Infrared thermography is non-contact, non-destructive, and incredibly versatile. It can be performed on live electrical systems, rotating machinery, refractory linings, and process pipelines. By catching problems early, thermography saves not only money but also reputation, safety, and schedule integrity.
Building a Proactive Maintenance Strategy with Infrared Thermography Condition Monitoring
Effective infrared thermography condition monitoring is more than taking pictures. It’s an engineered process. Reliability programs that succeed with thermography treat it as a key component of a broader predictive maintenance framework rather than a standalone inspection.
Step 1: Define Scope and Asset Criticality
Begin with an asset hierarchy. Rank components based on production criticality, failure impact, and accessibility. Common thermography candidates include:
- Electrical distribution panels, busbars, and transformers
- Bearings, couplings, and gearboxes in rotating equipment
- Refractory and insulation in furnaces and steam systems
Step 2: Establish Baselines
A baseline thermal image at normal operating conditions is your reference point. Every future inspection compares against it, allowing trend-based analysis rather than guesswork.
Step 3: Train for Interpretation
A clear image doesn’t equal a precise diagnosis. Proper interpretation requires understanding emissivity, reflections, load conditions, and thermal contrast. Certification programs such as ISO 18436-7 Level I and II provide structured skill development for thermographers.
Step 4: Integrate with Other Reliability Tools
Combine thermography with vibration analysis, ultrasound, and lubrication monitoring. Together, they create a multidimensional reliability ecosystem that detects degradation modes across electrical, mechanical, and thermal domains.
Step 5: Document and Automate
Link thermal findings to your CMMS or APM software. Automatic alerts, image tagging, and temperature trend reports ensure issues move quickly from detection to correction.
A thermogram without a work order is just a colorful picture – data must lead to action.
Diagnosing Hidden Faults with Infrared Thermography Condition Monitoring
The genius of infrared thermography condition monitoring lies in its ability to identify both obvious and hidden problems. Unlike vibration or acoustic sensors, thermography directly visualizes energy loss, such as heat escaping from friction, corrosion, or poor contact.
Electrical Applications
- Loose or corroded connections: create resistance and localized heating.
- Overloaded circuits or unbalanced phases result in uneven thermal patterns.
- Faulty fuses or breakers: show cold or hot deviations from expected temperature profiles.
Mechanical Applications
- Bearing wear: shows as a ring of elevated temperature on the housing.
- Misalignment or imbalance: creates asymmetric heating across shaft ends.
- Over-lubrication: produces excess friction and localized hot zones.
Process and Energy Applications
- Refractory degradation: shows temperature leaks through walls or ducts.
- Insulation failures: expose energy inefficiency and heat loss.
- Steam traps and valves: reveal flow restriction or blow-through failures.
To separate normal thermal variance from real danger, analysts must understand the context: load, environment, emissivity, and operating history. The best programs maintain a “thermal library” of reference images for each asset, enabling year-over-year data-driven comparisons.
Advanced practices include:
- Trending temperature deltas (ΔT) over time instead of absolute readings.
- Setting alarm thresholds relative to baseline performance.
- Conducting comparative scans under consistent environmental conditions.
When patterns recur, reliability teams can correlate thermographic data with vibration spectra or oil analysis results to pinpoint root cause—often months before failure.
Turning Thermal Data into Reliability Intelligence
Thermography’s most significant value lies not in the image itself; it’s in how the image informs decisions. Modern systems integrate infrared thermography condition monitoring into cloud-based APM platforms, where analytics and AI detect subtle patterns across hundreds of assets.
A mature program follows three evolutionary stages:
- Detection: Identify anomalies through regular scans.
- Diagnosis: Determine cause and risk using historical data and load analysis.
- Decision: Execute corrective maintenance, redesign, or parameter adjustment.
Plants that embrace this approach move beyond one-time inspections. They create living reliability systems where every scan refines future strategies. For example:
- A temperature rise on one bearing triggers an inspection.
- The inspection confirms misalignment.
- The root cause analysis leads to redesigned couplings.
- Subsequent thermograms verify the improvement.
That’s not just maintenance, it’s continuous learning.
Benefits of a mature program:
- Reduced unplanned downtime and emergency repairs
- Lowered energy consumption through early fault correction
- Enhanced safety through proactive electrical monitoring
- Improved documentation for insurance and regulatory compliance
When infrared data becomes part of the organization’s reliability DNA, it connects maintenance, engineering, and operations into one predictive ecosystem.
The Future of Infrared Thermography Condition Monitoring
The next generation of infrared thermography condition monitoring will merge AI, robotics, and automation. Drone-mounted thermal cameras already scan entire facilities for leaks and faults. Fixed sensors on critical assets continuously stream thermal data, turning periodic inspections into real-time monitoring.
Thermal imaging is also merging with digital twins. By mapping live thermal data onto 3D models, engineers can simulate heat flow, predict failure progression, and visualize energy losses across the entire plant.
Speculatively, the next decade may bring AI-powered anomaly learning, where algorithms distinguish “normal” from “abnormal” heat behavior across fleets of identical machines, eliminating the need for manual threshold setting.
Tomorrow’s plants won’t just see failures coming—they’ll feel them forming in the heat.
Thermography’s evolution mirrors reliability itself: from reactive firefighting to predictive precision to prescriptive intelligence. It’s no longer about taking pictures. It’s about seeing patterns, preventing losses, and understanding that reliability begins in the invisible spectrum.