
Ask a maintenance manager what it costs to hold a spare on the shelf and you will hear “about 25%” or “20 to 30% a year.” Ask where that number comes from and the room goes quiet.
That figure gets repeated in CMMS marketing, consultant decks, and finance trainings as if someone had measured it for spare parts. We could not find evidence that anyone has. The convention appears to have been inherited from general inventory and logistics research, and it has barely moved in decades.
This page does two things. It pins the carrying cost figure to the actual sources behind it, and it rates each one with the Reliable Confidence Score so you can tell the defensible numbers from the recycled ones. The short version: the framework for calculating carrying cost is solid, the percentage everyone quotes is a planning assumption dressed up as a benchmark, and we could not find an authoritative, MRO-specific carrying-cost benchmark in the sources we reviewed. Knowing that is worth more than a confident-sounding number.
What carrying cost measures, and where the numbers come from
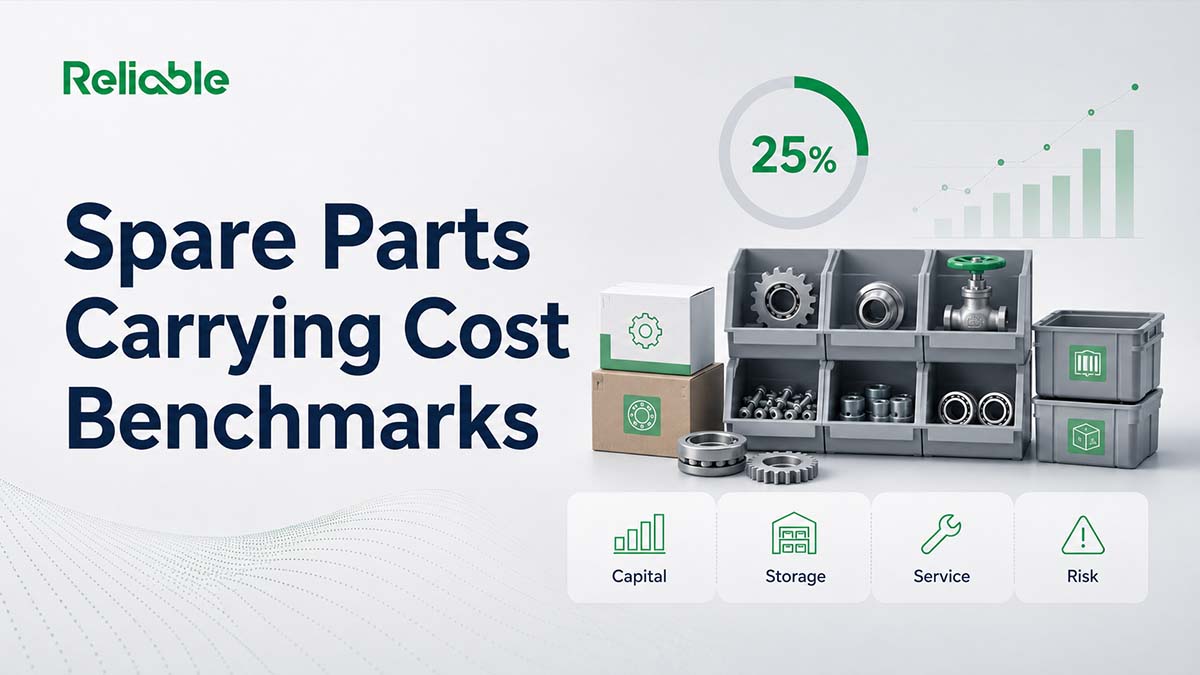
Inventory carrying cost is the annual cost of holding stock, expressed as a percentage of the average value of that stock. Hold $1,000,000 in spares at a 25% carrying rate and you are spending roughly $250,000 a year just to keep them on the shelf, before a single part is issued to a work order.
The percentage breaks into four buckets. That structure traces to a carrying-cost methodology Bernard La Londe and Douglas Lambert published in 1977, developed in a finished-goods logistics context, and it is the best-sourced part of this topic:
- Capital cost. The return you give up by tying money into inventory instead of using it elsewhere. This is usually the largest bucket, and it tracks the company’s opportunity cost of capital, which moves with interest rates but is not the same as a borrowing rate.
- Storage space. Rent, utilities, racking, the storeroom footprint, and the labor to count and internally handle stock.
- Inventory service. Insurance and property (ad valorem) taxes on the stock.
- Inventory risk. Obsolescence, shrinkage, damage, and relocation. For spare parts, this bucket behaves very differently than it does in a retail warehouse.
A spare bearing is not a carton of seasonal sneakers. Retail inventory turns several times a year and risk is dominated by markdowns. MRO inventory can sit for a decade as insurance against a failure that may never come, and its risk can be heavily influenced by obsolescence: the asset gets retired, the part gets superseded, and the stock quietly loses value while still showing full cost on the books. That difference is one reason carrying cost for spares is both higher-variance and harder to benchmark than the textbook number suggests.
The Reliable Confidence Score
We rated each commonly cited claim by how well it traces to a primary, verifiable source rather than by how often it appears online. A figure can be everywhere and still be Low.
| Source or Claim | Figure | Reliable Confidence | What It Really Means |
|---|---|---|---|
| Four-component framework (capital, storage, service, risk) per La Londe & Lambert, 1977 | A calculation method | Highfoundational | A widely used way to build a carrying rate from the ground up. Many estimates follow this four-part structure, even when they do not credit it. |
| An authoritative, standards-based MRO carrying-cost benchmark | None found in sources reviewed | Highnarrow negative finding | We did not locate a carrying rate set specifically for spare parts in any standards body (SMRP, ISO, EN) or peer-reviewed source we reviewed. MRO-specific research exists, but none we found establishes a universal rate. Stated this narrowly, it is the most defensible claim on the page. |
| The classic “25% of inventory value” textbook figure | ~25% / year | Mediumold, recycled | A real, citable convention from logistics texts. Lambert & Mentzer flagged in 1979 that it had been repeated for decades without re-deriving it or adjusting for interest rates. Treat it as a default rather than a measurement. |
| Richardson trade-press range (Transportation & Distribution, 1995) | 25% to 55% / year | Medium | A genuine published range with a component breakdown. Finished-goods focused, and the top end assumes heavy obsolescence. Thirty years old. |
| Benchmarks managers reported using (Lambert & Mentzer, 1979) | 12% to 35% / year | Medium | The range Lambert and Mentzer found managers applying in 1979, alongside the 25% textbook figure. A survey of practice rather than a measured result. Wide mostly because the capital bucket tracks the cost of money. |
| SMRP B&M Metric 1.4: Stocked MRO inventory value as a % of RAV | Top quartile 0.3% to 1.5% of RAV | Medium | A real, validated SMRP metric, but it measures how much you stock rather than what holding it costs. SMRP cautions the low target assumes mature practices, varies by industry, and must be balanced against stockout risk. The full guide is paywalled and these targets are widely reposted, so we present them as commonly cited. Do not confuse this with carrying cost. |
| “Spare parts carrying cost is 20 to 30%” (vendor and consultant content) | 20% to 30% / year | Low | The figure repeated most often in the M&R space. It appears to be the finished-goods convention applied to MRO, with no dedicated study behind it. Directionally plausible, empirically unsupported for MRO. |
| MRO dead, surplus, or obsolete stock share | Vendor and consultancy estimates range from ~15% to over 50% | Low | A real phenomenon with no benchmark behind the numbers. These figures circulate in vendor and consultant material without primary support, and they swing with plant age and storeroom discipline. Treat as a warning rather than a target. |
The Big Takeaway
The framework holds. The headline percentage does not stand up as a benchmark.
We could not find an authoritative, MRO-specific benchmark for what spare parts cost to hold. The 20 to 30% everyone repeats looks borrowed from general logistics literature rather than measured from spare-parts data. The number that matters is the one you build from your own shelves.
If you need a carrying rate for an EOQ calculation or a stocking decision, the 20 to 30% range is the placeholder most teams reach for. Just say so out loud. Label it as a placeholder rather than a measured KPI, and run the math on your own capital cost, storage, and obsolescence history before you defend it to finance.
Why the numbers disagree
Three reasons the published figures scatter from 12% all the way to 55%.
First, the capital bucket tracks the opportunity cost of capital. The same inventory carries a lower rate when money is cheap and a higher one when rates climb, because capital is usually the largest piece. A benchmark frozen at “25%” ignores that, which is exactly the critique Lambert and Mentzer raised back in 1979.
Second, obsolescence often helps drive the upper end of published ranges, and it is highly site-specific. A new plant with a tight active-equipment list looks nothing like a forty-year-old mill with bins full of spares for machines that left the floor a decade ago.
Third, people measure different things and use the same word for all of them. Some quote a planning rate. Some quote actual booked holding cost. Some quote inventory level (the SMRP RAV metric) and call it carrying cost. They are not interchangeable.
How to use these numbers safely
Build your rate from the framework rather than the headline. Work up your own four buckets: your real cost of capital, your storeroom cost, your insurance and taxes, and an obsolescence reserve based on your own dead-stock history. That bottom-up number will be more defensible than any benchmark, and it will survive a finance review.
If you only need a quick planning figure for an order-quantity model, 20 to 30% is the placeholder most teams use. Label it as one and move on.
For governing how much you stock rather than what it costs, look at SMRP Metric 1.4 (stocked MRO inventory as a percent of RAV), where top-quartile facilities generally sit under 1.5%. Keep in mind SMRP’s own caution: that low target assumes mature maintenance and inventory practices, varies by industry, and has to be balanced against stockout risk. Keep it separate in your head from carrying cost. One asks how much is on the shelf relative to the assets, the other asks what the shelf costs you per year.
Where teams go wrong
The most common error is treating 25% as a measured result instead of a planning input. It is an assumption that feeds models like EOQ. Reporting it up the chain as if you observed it invites a question you cannot answer.
The second error is conflating carrying cost with the SMRP RAV metric. A plant can hold a healthy 1.2% of RAV in inventory and still carry it at a 30% annual rate, because those measure different things. Mixing them produces numbers that look precise and mean nothing.
The third is leaving obsolete stock on the books at full value. A part tied solely to a retired asset may never be issued and may have little recoverable value, so the capital sunk into it can be largely a loss. Treat that as a write-down rather than an annual carrying rate.
The accounting mechanism depends on how the spare is classified: routine spares held as inventory are measured at the lower of cost and net realisable value under IAS 2, so they are written down when that value falls below cost, while major spares and stand-by equipment capitalized as property, plant, and equipment under IAS 16 are tested for impairment under IAS 36 (US GAAP applies comparable rules). Plants that skip the dead-stock review keep paying to store parts that should have been written down, and they understate their inventory risk in the process.
Methodology
The Reliable Confidence Score rates how well each claim traces to a primary, verifiable source, and it rates confidence in the claim rather than the precision of a single number. A narrowly stated negative finding (“we found no MRO-specific benchmark in the sources reviewed”) can score High, while a ubiquitous percentage with no study behind it scores Low.
We anchored the framework to the carrying-cost methodology La Londe and Lambert published in 1977 (developed in a finished-goods context), and the practitioner ranges to Lambert and Mentzer’s 1979 review of how managers estimate carrying cost in practice. We used the trade-press source most often cited for the broader range (Richardson, 1995) and anchored the inventory-level metric to SMRP’s published Business and Management metric set.
We rated the popular “20 to 30% for MRO” figure Low because it shows up almost exclusively in vendor and consultant material and appears to trace back to general logistics rather than any spare-parts study. Where a figure sits behind a paywall (the full SMRP guide), we present widely reposted target values as commonly cited and rate them Medium rather than treating them as verified. We did not include the “share of unplanned downtime caused by missing parts” statistic that circulates online, because we could not trace it to a primary survey.
This is editorial analysis for benchmarking purposes, not financial or accounting advice. Build your own rate before you book against it.
The Short Version
We could not find an authoritative, standards-based spare-parts carrying cost benchmark, and the figures quoted as if they were measured appear to trace back to general logistics estimates from the 1970s. The defensible move is to use the four-bucket framework, calculate your own rate from your own capital cost and obsolescence history, and treat the 20 to 30% convention as a labeled assumption. Keep carrying cost (what holding stock costs per year) separate from inventory level (how much you stock relative to RAV), and review your dead stock, because that is where the real money hides.
Frequently Asked Questions
What is a typical inventory carrying cost percentage for spare parts?
We could not find a verified benchmark specific to spare parts. The figure usually quoted, 20 to 30% of inventory value per year, appears to come from general logistics literature rather than any MRO study. Lambert and Mentzer documented in 1979 that the 25% convention had been recycled for decades without re-derivation. Use it as a planning assumption and calculate your own rate.
What does inventory carrying cost include?
Four buckets, per the La Londe and Lambert methodology (1977): capital cost (the return given up on money tied into stock), storage space, inventory service (insurance and taxes), and inventory risk (obsolescence, shrinkage, and damage). For spare parts, obsolescence is often a major swing factor.
Is the 25% carrying cost rule accurate?
It is a convention rather than a measurement. Lambert and Mentzer (1979) found managers using benchmarks from 12 to 35% and textbook figures of 25%, and noted the 25% number had gone unchanged for decades despite shifting interest rates. Treat 25% as a default input, then build your own from your real costs.
How much spare parts inventory should a plant hold?
SMRP Business and Management Metric 1.4 measures stocked MRO inventory as a percent of replacement asset value (RAV), with top-quartile facilities generally under 1.5%. SMRP cautions that the low target assumes mature practices, varies by industry, and must be balanced against stockout risk. This measures how much you stock rather than what holding it costs.
What is the difference between carrying cost and MRO inventory as a percent of RAV?
Carrying cost is the annual cost of holding stock as a percent of its value, which is a rate. SMRP’s RAV metric is how much inventory you hold relative to the value of your assets, which is a level. A plant can hold a healthy 1.2% of RAV and still carry it at a 30% annual rate. They answer different questions.
Why do spare parts carrying cost estimates vary so much?
Three reasons: the capital bucket moves with interest rates, obsolescence is highly site-specific (an old plant full of dead stock looks nothing like a new one), and people use the term “carrying cost” for a planning rate, an actual booked cost, and an inventory level interchangeably.
How much MRO inventory is typically obsolete?
There is no firm benchmark. Vendor and consultancy estimates range from about 15% to over 50%, and the share swings with plant age and storeroom discipline. The reliable move is to run your own dead-stock review against your active equipment list rather than trusting a published figure.
Sources
- La Londe, B.J. and Lambert, D.M. (1977). “A Methodology for Calculating Inventory Carrying Costs.” International Journal of Physical Distribution, Vol. 7, No. 4. DOI: 10.1108/eb014398. https://doi.org/10.1108/eb014398 (Related open-access case study: La Londe & Lambert (1976), “A Methodology for Calculating the Cost of Holding Inventory: A Food Industry Example,” https://doi.org/10.22004/ag.econ.27880)
- Lambert, D.M. and Mentzer, J.T. (1979). “Inventory Carrying Costs: Current Availability and Uses.” International Journal of Physical Distribution & Materials Management, Vol. 9, No. 6, pp. 256-271. DOI: 10.1108/eb014449. https://doi.org/10.1108/eb014449
- Richardson, H. (1995). “Control your costs then cut them.” Transportation & Distribution, December 1995, pp. 94-96. (Trade press; archival print, no stable public URL.)
- Stock, J.R. and Lambert, D.M. (1987). Strategic Logistics Management, 2nd ed. Irwin Professional Publishing. (Cited as an example of the 25% textbook convention; Lambert & Mentzer (1979) is the primary documentation of that convention’s persistence.)
- Society for Maintenance & Reliability Professionals (SMRP). Best Practices, Business & Management Metric 1.4, “Stocked Maintenance, Repair and Operating (MRO) Inventory Value as a Percent of Replacement Asset Value (RAV).” Published 2009, revised 2020. https://smrp.org
- IFRS Foundation. IAS 2 Inventories (lower of cost and net realisable value); IAS 16 Property, Plant and Equipment (para 8: spare parts and stand-by equipment recognised as PP&E when they meet the PP&E definition, otherwise as inventory); IAS 36 Impairment of Assets. https://www.ifrs.org/issued-standards/list-of-standards/ (US GAAP applies comparable provisions under ASC 330 and ASC 360.)