Vibration Analysis: Techniques, Tools, and Benefits
What Is Vibration Analysis?
Vibration analysis is the practice of monitoring and assessing machinery's vibration characteristics to identify anomalies and evaluate equipment health. By measuring variations in amplitude, intensity, and frequency, this technique allows for detecting changes in the vibration signature that can indicate underlying physical conditions.
An accelerometer captures the vibration data, converting it into voltage signals representing the frequency and magnitude of the machine's movements. This information is essential for diagnosing potential issues, predicting failures, and maintaining optimal machine performance.
Data collected from the accelerometer is fed directly into a data collector, which records the signal as either amplitude versus time (time waveform), amplitude versus frequency (fast Fourier transform), or both.
The next step involves using advanced computer algorithms to process this data, which is then further analyzed by engineers or trained vibration analysts. This analysis helps determine the machine's health and identify potential issues such as looseness, imbalance, misalignment, lubrication problems, and other impending faults.
Vibration analysis can be applied to:
Identify developing issues that can be repaired to extend the machine's lifespan.
Detect and track chronic problems that are beyond repair and will progressively worsen.
Set acceptance testing standards to verify the proper execution of installations and repairs.
Enable 24/7 continuous vibration monitoring to predict failures as part of a predictive maintenance strategy.
What Are the Main Vibration Analysis Techniques?
The primary vibration analysis techniques used in industrial maintenance include:
Time-domain analysis
Frequency-domain analysis (FFT)
Envelope (demodulation) analysis
Joint time–frequency analysis (STFT, wavelet)
Modal analysis
Each technique reveals different fault characteristics and is typically used in combination.
When Should Each Vibration Analysis Technique Be Used?
Time-domain: Impacts, looseness, rubs, transient events
FFT: Imbalance, misalignment, gear mesh, bearing frequencies
Envelope: Early-stage bearing faults
Joint time–frequency: Non-stationary or transient behavior
Modal: Structural resonance and stiffness issues
What Does Vibration Analysis Detect?
Vibration analysis is a powerful tool for assessing equipment condition and performance. Maintenance teams can identify issues that compromise machine reliability by analyzing vibration data. For example, it can detect broken welds or bolts, evaluate the integrity of rotor bars in motors, and check for non-concentric air gaps between rotors and stators.
Additionally, vibration analysis can reveal structural looseness, rotating component looseness, and harmful resonance.
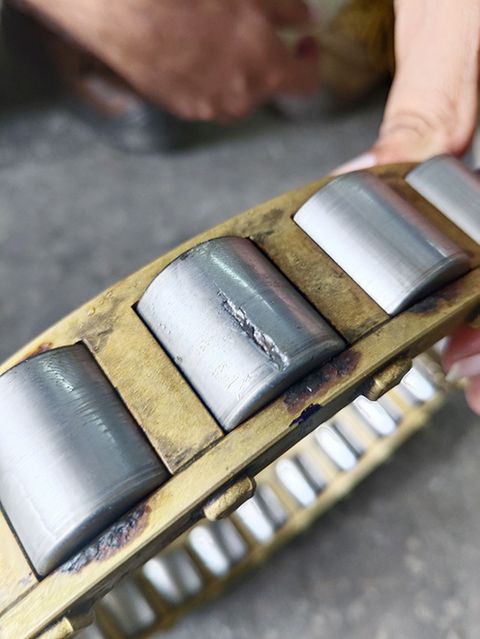
Vibration analysis can reveal symptoms associated with bearing installation problems, but it does not, by itself, verify correct bearing clearance or preload. Verify these settings using the manufacturer’s specified procedures. Misalignments in assemblies, such as pumps, can also be detected, allowing teams to identify issues like binding rotating elements, uneven bases, or torsion between connected components.
How Does Vibration Analysis Detect Possible Failures?
Understanding how vibration analysis predicts potential asset failures is crucial to effective machinery maintenance. Every machine produces a unique vibration signature or profile during operation. Monitoring and analyzing these signatures can identify deviations or anomalies, signaling potential issues within the equipment or its components.
When an unusual vibration pattern is detected, maintenance teams assess whether it indicates a failure. Spectrum analysis is vital in this process using techniques like the Fast Fourier Transform (FFT). By converting the vibration data from the time domain to the frequency domain, spectrum analysis reveals the specific frequencies within the vibration signal. These frequencies help pinpoint the exact source of the anomaly, allowing for accurate diagnosis and timely intervention to maintain the machine's health and functionality.
The Fundamentals of Vibrations
Vibrations are complex and require consideration of multiple parameters for accurate analysis. The main parameters include amplitude, frequency, and phase:
Amplitude refers to the size or magnitude of the vibration, measured in units such as displacement (mils or micrometers), velocity (inches per second or millimeters per second), or acceleration (g's).
Frequency indicates how many oscillations occur within a specific time frame, typically measured in Hertz (Hz).
Phase represents the timing relationship of the vibration waveform, usually measured in degrees.
Vibration analyzers utilize these parameters, waveform shape, and harmonic content to diagnose and assess the severity of specific machine faults.
Vibration can be a free vibration (i.e., the vibration is a free response to an initial disturbance) or a forced vibration (i.e., the vibration is a response to continued excitation).
Free vibration occurs following an initial displacement or impact with no continuing external excitation. The structure vibrates at its natural frequencies and damping will normally cause the response to die out over time.
Forced vibration occurs when an external excitation is acting on the machine or structure. Resonance is an amplified response when an excitation frequency approaches a natural frequency. Natural frequency and resonance are related concepts but they are not the same thing. [2]
How Is Vibration Measured?
Vibration is measured using a variety of sensors designed to capture different aspects of vibration, such as displacement, velocity, and acceleration. These sensors employ various technologies, including piezoelectric (PZT) sensors, microelectromechanical systems (MEMS), proximity probes, and laser Doppler vibrometers.
PZT sensors are the most commonly used. They generate voltage when they are deformed by vibration. This voltage is then digitized and analyzed to represent the vibration characteristics. When selecting the appropriate sensor, factors such as vibration levels, dynamic range, maximum frequency range, and environmental conditions (e.g., temperature, humidity, and pH) must be taken into account.
Proper sensor installation is crucial for accurate data collection. The best practice is to stud mount the sensor on a flat, clean machine surface to capture a wide and smooth frequency spectrum.
If stud mounting isn't possible, alternatives like magnet holders, wax, or adhesive can be used, with consideration given to the vibration levels and frequencies involved.
Typically, vibration signals fall below 20 kHz, although certain resonances may exceed this range. It is essential to carefully select the sampling rate to ensure the frequency range of interest is captured. Additionally, the recording duration should encompass several cycles of the machinery's lowest operating speed to ensure comprehensive data collection.
Four Types of Vibration Analysis Equipment
Effective vibration testing requires precise measurement of vibration waves. There are four primary methods for measuring these waves:
Global Level Vibration Meters
These meters, with or without filters, assess a machine's or structure's overall vibration level. Filters allow the selection of specific frequency ranges, helping to isolate particular issues.
Accelerometer
These devices measure the acceleration of a vibrating object, providing insights into the amplitude and frequency of the vibration.
Velocity Sensors
These sensors help determine the amplitude, frequency, and velocity of vibration by measuring the velocity of a vibrating object.
Displacement Sensors
These sensors track the displacement of a vibrating object, offering a measurement of the vibration's amplitude.
Where Should Vibration Sensors Be Installed?
It's recommended that vibration sensors be placed on your most critical machinery. These sensors are essential for monitoring the condition of all your rotating equipment, such as:
Motors
Gearboxes
Pumps
Fans and belts
Conveyor systems
Automated assembly lines
Chillers
When beginning a condition monitoring program, prioritize installing vibration sensors on crucial equipment for sustaining production. Position the sensors close to the motor, pump, and shaft bearings. If you're uncertain about the best locations or installation methods, consult with condition monitoring specialists.
How to Turn Vibration Data into Maintenance Decisions
A good vibration analysis program links repeatable measurements to specific maintenance actions. Before recommending a repair, establish what changed, whether that change reflects the machine's condition, and what evidence supports the suspected cause.
Capture Comparable Measurements
Record the asset, the bearing location, the measurement direction, the sensor mounting method, the actual running speed and the load. Note the operating conditions (e.g. warm-up, valve position, production rate) as these will have an effect on the machine. Changes in speed or load can change vibration readings and be mistaken for a developing fault. [1]
Keep the measurement point and collection settings the same. Record the units, amplitude convention, frequency range and resolution with the data. Use an appropriate mounting method for the frequencies of interest and ensure that the sensor and mounting are capable of capturing those frequencies. [2]
Compare with a Meaningful Baseline
Compare the new reading with the same machine in a known good/satisfactory condition. Look at the trend as well as the latest reading. If the method of measurement or the operating condition has changed then deal with that difference prior to concluding that the machine is deteriorating.
Assess both the level of vibration and any trends over time using the relevant machine specific criteria and OEM guidance. ISO 20816-1 gives the general principles of evaluation; the relevant machine specific part or other applicable standard will contain the detailed requirements. A single generic alarm value will not be applicable to all machines, all support arrangements and all measurement locations. [3]
Confirm the Cause and Verify the Repair
Use the suspected failure mode to select the next check. That could be measurements in additional directions, phase measurements, an envelope spectrum, an alignment check or an inspection during a planned stop. Record the finding separately from the suspected cause so the work order doesn't take an unconfirmed interpretation and turn it into a prescribed repair.
Include the asset and the measurement point, the supporting plots, the comparison conditions, the recommended inspection or corrective action, the responsible person and the follow up requirement on the work order. Once the maintenance has been performed, take the measurements again under the same comparison conditions. Maintain the original baseline and the before and after results so that the team can assess whether the intervention has in fact addressed the observed change.
Understanding Acceleration, Velocity, and Displacement Parameters
Acceleration, velocity and displacement are all different aspects of vibration. The most useful parameter to measure will depend on the machine, the frequency range of interest, the sensor layout and the failure mode under investigation. There is no one parameter that is the best for all situations.
Acceleration is the rate of change of velocity and is usually given in g or m/s². It's of use in looking at higher frequency activity, for example the impacts associated with rolling bearings. Envelope processing can be used to bring out the repetitive impacts within an appropriate acceleration frequency band. [7]
Velocity is a measure of how quickly the vibrating surface is moving and is normally expressed in mm/s or in/s. It's a very common parameter used to trend overall vibration on bearing housings. The value reported must include its amplitude convention and measurement band if it is to be of any use for comparison. [5]
Displacement is movement and is generally expressed in micrometres or mils. Proximity probes can be used to measure shaft movement relative to the bearing housing and this is of value in certain fluid film bearing applications. A shaft relative displacement reading is quite different from a casing reading and must be assessed as such. [2]
How to Read a Vibration Spectrum
A vibration amplitude spectrum breaks down a measured signal into its frequency components. The X axis is frequency, and the Y axis is amplitude. Check the axes and operating speed before assigning a possible fault to a peak.
Convert Running Speed to Frequency and Orders
Divide the measured shaft speed in revolutions per minute by 60 to get the running frequency in hertz. A shaft measured at 1,800 RPM is running at 30 Hz. Its first order (1X) is 30 Hz, 2X is 60 Hz and 3X is 90 Hz.
An order is a frequency expressed as a multiple of the reference shaft's running frequency. To work out the order you simply divide the frequency of interest by the running frequency of the reference shaft. Use the correct shaft (a belt drive or gearbox can cause the motor and the machine it's driving to run at different speeds).
When speed is changing significantly during collection a conventional spectrum will tend to spread the rotating components over a number of frequencies. Order tracking uses the speed information to help track the components associated with shaft rotation. It doesn't get rid of the need to consider the load and other operating conditions at all. [4]
Check the Measurement and Display Settings
Confirm whether the plot is of acceleration, velocity or displacement and whether the amplitudes are RMS, peak or peak-to-peak. A spectral component is not the same as an overall reading derived from a band of frequencies. Make sure you have matching measurements before you conclude that vibration has increased. [5]
Make sure the displayed frequency range includes the components you're interested in. If you've got closely spaced peaks you'll need appropriate frequency resolution. Windowing will also have an effect on leakage and peak shape so changing your acquisition or processing parameters is likely to alter the appearance of your spectrum. [6]
Look for Relationships Between Peaks
Look for running-speed harmonics, other regularly spaced groups of peaks, and changes from earlier spectra. Harmonics will be at integer multiples of the fundamental. Sidebands will be located around a central component and can be indicative of modulation, but you need to interpret the spacing of the sidebands in the context of the actual running speeds and the machine construction.
Check the time waveform for impacts and compare the appropriate measurement directions and phase relationships. A large 1X peak can be consistent with an imbalance diagnosis but doesn't prove it on its own. The useful conclusion is one that takes the pattern, the operating context and the corroborating evidence into account. [7]
Common Vibration Fault Patterns
Use the following patterns to select the next diagnostic check. They describe potential causes rather than being repair instructions in any sense. More than one fault can give rise to the same symptom and a fault can manifest itself in very different ways depending on speed, load or the direction of measurement. [7][8]
Possible fault | Pattern worth investigating | Checks that strengthen the diagnosis |
|---|---|---|
Imbalance | A dominant or increasing radial 1X component. | Compare directions and phase; inspect the rotor for deposits, damage, or missing material. Exclude mounting and structural problems. |
Misalignment | Elevated 1X or 2X components, sometimes with substantial axial vibration. | Compare measurements across the coupling, review phase relationships, and check alignment under the appropriate machine conditions. |
Mechanical looseness | Several running-speed harmonics, sometimes accompanied by impacts. | Inspect mounting bolts, the foundation, bearing fits, and relevant component clearances. Check the waveform for repeated impacts. |
Rolling-bearing damage | Repetitive components near calculated bearing defect frequencies, often clearer in an envelope spectrum. | Check bearing geometry and speed, check the expected defect frequencies, check the lubrication and all the other evidence. A non-integer peak by itself is not enough. |
Resonance | A strong response associated with excitation near a natural frequency. | Use an appropriate controlled test, such as an impact test or approved run-up/coast-down measurement, to investigate the structural response. |
Assess Urgency Separately from Fault Type
A suspected fault in itself does not establish any remaining bearing life or a safe operating interval. You have to look at the trend, the rate of change, the operating conditions, the machine criticality and any supporting evidence before you decide whether you go for further monitoring, planned maintenance or immediate escalation.
Apply the relevant severity criteria within their defined scope. ISO 20816-3 for instance deals with the assessment of broad band vibration for specified industrial machines and does not provide for the diagnostic assessment of gear or rolling bearing condition. A satisfactory overall value can therefore be in existence alongside a developing component fault. [9]
Worked Example of a Motor-Driven Fan Diagnosis
This is a hypothetical example of how measurements can be used to guide an investigation. The values are entirely illustrative and are not alarm limits or actual results from a plant.
Establish What Changed
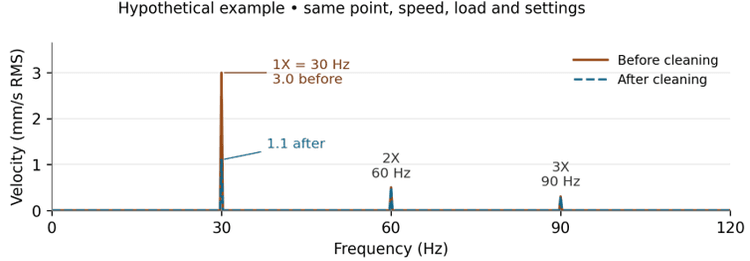
A fan shaft is measured at 1,800 RPM, so its running frequency is 30 Hz. At one of the horizontal bearing housing locations the 30 Hz velocity component has gone from a known baseline of 1.0 mm/s RMS to 3.0 mm/s RMS. The readings are from the same point, same mount, same acquisition settings and comparable speed and load.
The increase is concentrated at 1X; the 2X and 3X components have smaller amplitudes. That would make imbalance worth looking at, but the analyst doesn't go on to prescribe balancing from that peak.
Test the Suspected Cause
The analyst goes through the other measurement directions, the phase information and the waveform, then looks for any sign of looseness or alignment issues. During an authorized shutdown with the machine isolated, inspection of the fan wheel shows uneven deposits, which supports the imbalance theory and gives them a very specific condition to look at.
Verify the Result
After cleaning and inspection, the team repeats the measurements under comparable conditions. In this example, the 1X component drops to 1.1 mm/s RMS, close to its original baseline. The 2X and 3X components remain similar, so the change is concentrated in the 1X component.
The result supports the assessment that the deposits contributed to the increased vibration. It doesn't prove that all possible faults have been ruled out. The team records the inspection results, saves both spectra and schedules the next set of measurements to see if the improvement is sustained.
Benefits of Vibration Monitoring
Vibration monitoring, whether part of a predictive maintenance program or through continuous observation, offers significant advantages for equipment management and operational efficiency.
Lower Maintenance Costs
Vibration monitoring helps avoid expensive repairs and replacements by proactively addressing potential failures. This saves money and contributes to sustainability by reducing energy consumption.
Early Fault Detection
Advanced vibration analysis can detect issues before they become severe enough to be noticed by other means. This early detection allows maintenance teams to address problems before they lead to costly downtime.
Improved Maintenance Planning
With detailed insights into machinery condition, maintenance teams can better plan and schedule their work. This optimizes resource allocation, enhances equipment reliability, and reduces unplanned downtime.
Enhanced Safety
Vibration monitoring helps predict breakdowns and identify malfunctioning machinery, reducing the risk of accidents and injuries.
Optimized Machinery Performance
Continuous vibration monitoring ensures real-time data collection and analysis, allowing immediate response to detected anomalies. This is especially beneficial for critical, heavily used, or hard-to-access equipment, where early detection of issues can prevent major disruptions and financial losses.
By integrating these monitoring practices, organizations can maintain high levels of equipment reliability, minimize operational interruptions, and ensure a safer working environment.
The Role of Vibration Analysis in Predictive Maintenance
Predictive maintenance uses condition measurements and trends to identify developing degradation and plan intervention before functional failure. Vibration data may come from periodic measurements or online monitoring.
This approach allows maintenance actions to be scheduled during planned downtimes, reducing the risk of unexpected breakdowns and optimizing the use of resources.
Vibration analysis has the ability to detect subtle changes in a machine's vibration signature, such as those caused by misalignment, imbalance, or bearing wear. These early warnings let maintenance teams intervene before minor issues escalate into major failures. For instance, an increased vibration amplitude at a specific frequency might indicate that a bearing is beginning to wear out. By addressing this issue proactively, teams can prevent costly unscheduled shutdowns and extend the lifespan of the equipment.
Vibration analysis within a predictive maintenance framework can identify when a repair is needed and the root cause of the issue. Engineers can tailor their maintenance actions more precisely by distinguishing between various vibration sources—such as overall machine condition and specific faults like unbalance or looseness.
Incorporating vibration analysis into a predictive maintenance program offers a comprehensive, data-driven method for maintaining machinery health, helping ensure operational efficiency, and minimizing downtime.
Key Takeaways
Vibration analysis detects faults before failure
No single method works for all problems
FFT and time waveform form the foundation
Envelope analysis can help detect rolling-element bearing defects
Sensor selection and mounting affect accuracy
Combining methods improves diagnostic confidence
Frequently Asked Questions
What is vibration analysis?
Vibration analysis is the practice of monitoring and assessing machinery's vibration characteristics to identify anomalies and evaluate equipment health. By measuring variations in amplitude, intensity, and frequency, the technique allows for detecting changes in the vibration signature that indicate underlying physical conditions. An accelerometer captures the data, which is then analyzed in the time domain, frequency domain, or both to diagnose issues such as imbalance, misalignment, looseness, and bearing wear.
What faults can vibration analysis detect?
Vibration analysis can detect imbalance, misalignment, bearing defects, looseness (both structural and rotating component), gear wear, resonance, and shaft problems. It can also reveal broken welds or bolts, evaluate rotor bar integrity in motors, identify non-concentric air gaps between rotors and stators, and identify symptoms that warrant checks of bearing installation.
What are the main vibration analysis techniques?
The primary techniques are time-domain analysis (for impacts, looseness, rubs, and transient events), frequency-domain analysis using FFT (for imbalance, misalignment, gear mesh, and bearing frequencies), envelope or demodulation analysis (for early-stage bearing faults), joint time–frequency analysis using STFT or wavelet methods (for non-stationary behavior), and modal analysis (for structural resonance and stiffness issues). Each reveals different fault characteristics and is typically used in combination.
Which vibration analysis technique is best for bearings?
Acceleration envelope analysis is often useful for detecting repetitive impacts associated with developing rolling-element bearing defects. Interpret the envelope spectrum alongside appropriate vibration spectra and time waveforms. Effectiveness depends on operating speed and load, sensor installation and data acquisition settings.
How is vibration measured?
Vibration is measured using sensors that capture displacement, velocity, or acceleration. Common sensor technologies include piezoelectric (PZT) sensors, microelectromechanical systems (MEMS), proximity probes, and laser Doppler vibrometers. PZT sensors are the most widely used because they generate voltage when deformed by vibration, which is then digitized and analyzed. Proper sensor mounting—ideally stud-mounted on a flat, clean machine surface—is critical for accurate data.
What are the four types of vibration analysis equipment?
The four primary types are global level vibration meters (which assess overall vibration level, with or without filters), accelerometers (which measure acceleration to provide amplitude and frequency data), velocity sensors (which measure the velocity of a vibrating object), and displacement sensors (which track the physical displacement of a vibrating object).
Where should vibration sensors be installed?
Sensors should be placed on critical rotating equipment essential to production, including motors, gearboxes, pumps, fans and belts, conveyor systems, automated assembly lines, and chillers. Position sensors close to the motor, pump, and shaft bearings. When starting a condition monitoring program, prioritize the most critical assets first.
Is vibration analysis preventive or predictive maintenance?
Vibration analysis is a condition-monitoring technique used in predictive maintenance. Periodic measurements or online monitoring can reveal developing faults and help teams plan maintenance before equipment loses its required function.
How often should vibration data be collected?
Set measurement intervals according to asset criticality, fault development time, operating conditions and the consequences of failure. Collect data often enough to investigate developing problems and take corrective action before functional failure. Consider online monitoring when periodic measurements cannot provide adequate warning.
What are the benefits of vibration monitoring?
Key benefits include lower maintenance costs through proactive fault detection, early identification of developing problems before they cause failures, improved maintenance planning and resource allocation, enhanced safety through reduced risk of catastrophic breakdowns, and optimized machinery performance through real-time condition data on critical equipment.
Sources
[1] Fluke. The Importance of Standard Test Conditions: Test Speed and Test Load
[2] NI. Measuring Vibration with Accelerometers
[3] ISO. ISO 20816-1:2026
[4] NI. Vibration Analysis and Signal Processing in LabVIEW
[5] Rockwell Automation. Applying Condition Monitoring to Various Machinery
[6] NI. Understanding FFTs and Windowing
[7] SKF. Vibration Diagnostic Guide
[9] ISO. ISO 20816-3:2026