
Lower sensor costs, enhanced sensor quality, and improved vibration platform capabilities have fueled the shift to wireless online vibration monitoring. Additionally, the scarcity of qualified vibration analysts is further accelerating this transition.
Unique Challenges in Route-Based vs. Online Monitoring
Both route-based and wireless online vibration monitoring processes can be successful, but both have unique challenges that must be addressed and planned for.
Experience and Historical Context
Since 1995, I’ve worked in vibration analysis—whether route-based, wireless remote, or hybrid—both in-house and as a contractor. My background spans mechanical maintenance, emergency repairs, preventive maintenance, new installations, and precision maintenance repairs.
Ultimately, keeping a plant safe is paramount, even if that means deviating from traditional precision maintenance practices at times. I often see online posts about subpar repairs or processes, but without full context, I withhold judgment unless safety is clearly at risk. I share this to provide context for the rest of the article.
Let’s begin with the popular claim that switching from portable vibration routes to an online monitoring system eliminates unscheduled downtime. If I were a production manager unfamiliar with the maintenance and reliability world, that statement alone would make me eager to adopt it in my plant.
Online monitoring opens new avenues where traditional methods have overlooked issues.
I often encounter claims that online systems spot issues that route-based programs have overlooked. I can argue both sides, but in my experience, most “missed opportunities” stem from organizations failing to act on identified issues promptly, resulting in asset failure.
The answers can be complex, which I want to address here. I started vibration work in 1995 with a CSI 2110 vibration data collector and ran routes on close to 600 machines monthly with speeds ranging from 3600 rpm to 17 rpm. I did this with a typical setup of 400 lines and 100 order Fmax. I found issues that many today say I need to have 6400 to 12,800 LOR and Fmax out to 10kHz or higher.
Trust your instincts—data is only part of the story; your senses complete the picture.
Early on, I learned to work with the available data—even if it’s not perfect—while recognizing that my expertise is as valuable as the instrument. I was trained to engage all my senses during data collection—look, listen, feel, and even smell—using any extra time the process afforded me.
My mentors, Bob Knox on the mechanical side and David Hamilton on the electrical side, consistently reinforced this holistic approach as they helped me develop my analytical skills.
Case Study: Gearbox Inspection and the Key Issue
Initial Data Collection and Early Observations
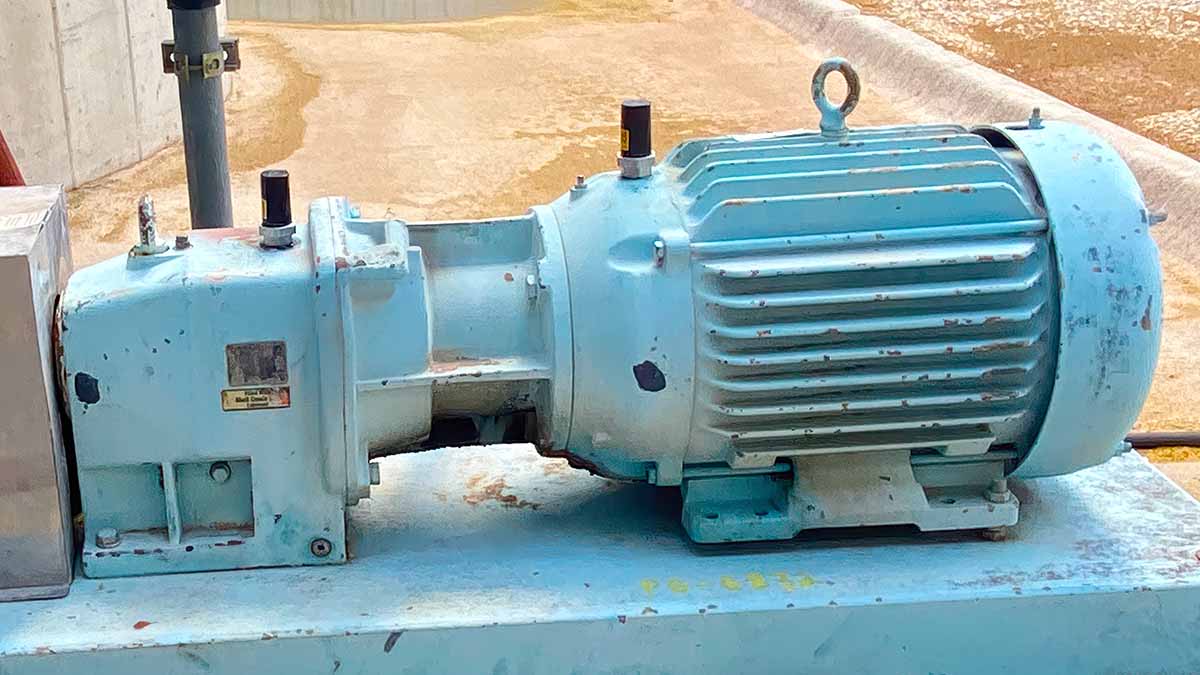
Let me share a quick story illustrating the value tradeoff between a route-based vibration analysis program and an online system. One of my first significant findings was on the gearbox, as shown in Figure 1.
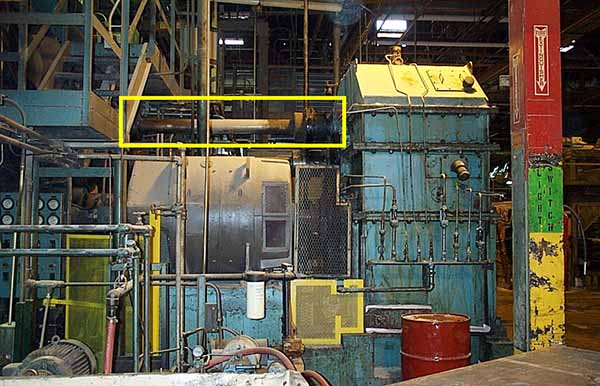
Figure 1: Calendar machine.
It is the main drive of a 4-roll calendar with four output shafts driving the calendar rolls, which typically ran 18 rpm. The gearbox was between 15 to 20 feet tall and complex in that it had 6 shafts with 5 gear sets. It is hard to see, but the drive shafts come out of the 4 sections of this gearbox behind this motor; the top shaft has a yellow box around it, and there were 3 more below this one.
First, this was 1996, and just collecting the data today would be challenging because I was inside the cage area behind the motor where all the drive shafts came out. Today, we can install wireless online vibration sensors and never have to enter that area.
We could also install remote vibration sensors and pipe the sensors out to a BNC box to collect the data, but at that time, the organization was unwilling to spend the amount of money the system required. Those two setups may not have identified the issue I found that day.
A subtle visual cue can reveal hidden mechanical issues that raw data might miss.
As I collected the data, I looked at the gearbox and the area around the split line of the drive shaft coupling. The gearbox was winking at me. I would see a slight change in the oil line in the area where the shaft came out of the box at the split line of the case.
There were no drips or runs, just a slight line of oil that would come and go. No noise, no real heat, just a slight change in the area’s look. The data displayed on the vibration analysis data collector was not actually showing anything either. No truncated waveform or low-frequency haystack.
When I went back to the office to look at the data more closely, it did not show any impacts or truncation in the waveform, and there was nothing in the spectrums, so I was a little stumped. I took some additional data using the data collector analysis function. I had Bob come back, and we went through the data together, but he did not see anything either.
Your on-site observations can be just as crucial as the instruments in your toolbox.
The discussion concerned the value of my being at the machine, paying attention to it, and doing my AVO inspections. However, we did not call it AVO at the time. It was, “Kid, while you stand there, look around because that data collector will not always pick up everything. You are just as important as the tool, and other things in the area may need to be fixed, so record those on your yellow cards.”
Field Inspection and Collaborative Analysis
After reviewing the data, we went to the area, and I showed Bob what I saw. His first task was to inspect all the other coupling areas of that gearbox, looking for similar things. None were found. Back then, we carried a small contact-type thermometer. We checked for temperature anomalies in the area and did not see anything there either.
Bob reviewed our oil analysis reports, which showed no changes over the last year. Bob also checked with the lube tech to see if he had been adding oil to the sump, which he had not. This sump had around 350 to 400 gallons, so the lube levels had to get low enough to require topping off. The sump had inline oil filters on it.
The organization had an excellent PM program on our critical machines at the time, and these calendars were taken down one shift every month to do scheduled PMs and other as-needed work.
We monitored this gearbox daily for changes. Bob had additional samples pulled and waited until the scheduled PM before pulling inspection covers to do a visual inspection a few weeks later. We found that a gear key slowly walking out of the gear.
The key there was not fully filling the keyway, and for whatever reason, after 10 or 15 years, it had started to creep out. It slowly contacted the gearbox lip and metal oil dam in the section’s bearing area. The gear key slowly machined a slot from the case edge around the bore. This was what was causing the split line to “wink” at me.
Group Decision-Making and Interim Repair Strategy
This approach might raise eyebrows, but group decision-making is key—a lesson Bob and David instilled in me. Bob immediately called the plant engineer and plant manager to come see our findings firsthand.
Collaboration and group insight drive effective decisions in critical repair moments.
After the discussion, we tried to use porta power to press the key back in place, but it did not work. We had to use the gearbox case to press against it and were afraid we could damage it, so we stopped. Taking the gearbox down would have a major impact on production because it was the only one that could run the steel belted fabric for the radial tires.
We knew we had to keep the key from moving any further, or it would eventually machine a hole in the side of the gearbox. We had no idea how long it had taken to get where it was presently. Since we could not move the key, we decided to tack it to the shaft for now and develop a job to pull the gears out and rebuild them at the Christmas shutdown.
Now, using that example as a big positive for the route-based vibration program versus the remote online vibration sensor program, visual inspection will no longer coincide with data collection. So, suppose you are going to a remote vibration monitoring program. In that case, you need to first put together a plan for the visual inspections that will no longer be part of the typical vibration program.
Essential Tools for Effective Vibration Analysis
In Figure 2 below, you can see everything I carried when running my routes:
- Flashlight
- Paint markers to mark collection location and make other reference marks on machines
- Notepad
- Feeler gauges for checking soft foot and other forms of loose fits
- Extra vibration sensors and cables for phase work
- Spark plug pliers to extend my reach and keep my hands away from the danger zones
- Strobe light for inspections and finding speeds
- Small IR camera above the cables to check for hot spots
- Phone camera (above the belt between the flashlight and pens)
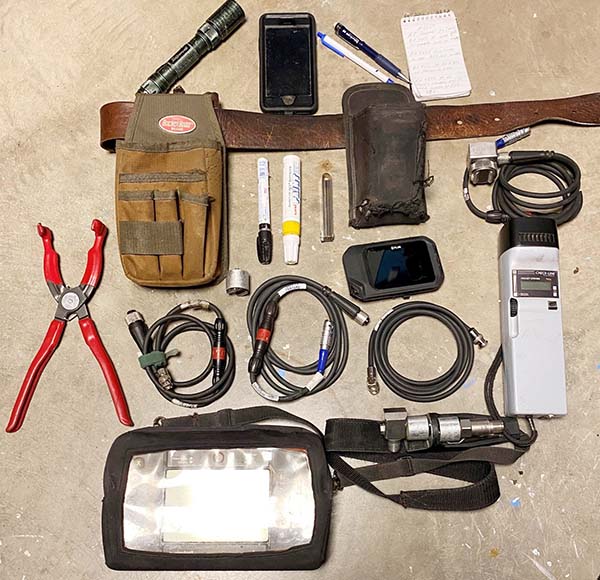
Figure 2: Typical vibration analysis data collection kit.
Ultimately, my phone replaced the small digital camera I had used for many years when it first came out. I’m showing you what I feel are the minimum tools to carry when running routes and doing visual inspections. Today, I see many people running vibration routes; all they bring is their data collector.
My original mentors would have racked me across the carpet if the data collector were all that I carried. When I challenge some techs today about this, they tell me if they see something, they go back with more tools and do further investigations.
That is a tremendous waste of time. If the issues were process related and when you go back, they are running a different process, speed, or the environment has changed, will that same issue still be there?
An example of this was a mill that would show a different gear mesh pattern when it ran a harder stock. The pattern changed when running softer stock or with a lower bank. The bull gear in this box had actually cracked across the keyway. It was a spoked gear, so under the heavier loads, as the gear came into the load zone at the key, it would spread slightly, affecting the gear tooth clearances.
Fast-forward to today, when I am doing remote monitoring work. Now, all I have are the tools shown in Figure 3: a computer, calculator, machine data files, and my reference books. The computer also serves as my phone, so I can talk to a site through Teams, Zoom, and Slack calls.
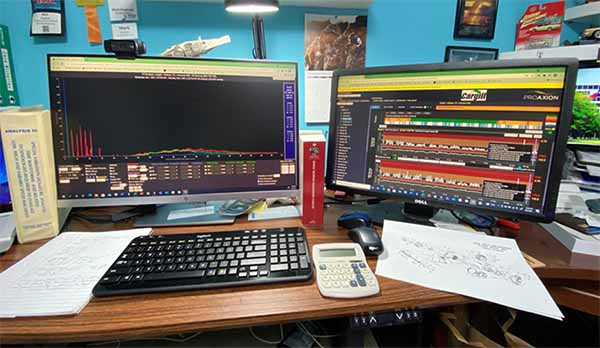
Figure 3: Typical remote vibration monitoring tools.
Establishing Communication and Inspection Protocols
This brings up a couple of important topics to address.
Educating and Engaging On-Site Personnel
First, establish a clear education and communication plan. The team needs to understand their role in identifying and addressing vibration changes. Additionally, they must promptly inform us about any maintenance work, process modifications, or observations made during preventive maintenance.
Emphasizing Timely Communication and Feedback
While doing full-time remote work for one organization, I monitored 43 sites, and only 10 were fully engaged and committed to communications. I saw a temperature spike in one instance and contacted the site about it. I initially asked if they had just greased the bearings in this machine because of the jump.
I explained how greasing bearings can cause temperature spikes but that they should drop back to normal levels within the day. I did not hear anything back. The next day, it continued to increase, so I requested more information through vibration tracking software, email, and a phone message.
Again, no response. The following morning, I got a call about a major failure and a fire at that facility, which shut the facility down. It was bad enough that it would be down for an extended period while they replaced the conduit, wiring, and other damaged items. The original discussion was about what we had missed that allowed this failure to happen.
The only thing the reliability leader of the organization knew, since he was off-site too, was that when he looked at the data in the dashboard, the temperature was trending up until it went silent. It went silent because the vibration sensor melted in the fire. I explained to him that I had sent communications in the dashboard, emails, and phone messages, and the site had not responded.
One of the most significant issues I see when a facility converts from a route-based vibration program to a remote vibration program is the pushback at times to requests for inspection or additional information. One of the most common responses is, “Why do I have to do these inspections for you? You have the data; when we did it before, we were never asked these questions.”
My typical explanation is that before, I collected data at the machine once a month, so I did these inspections when I was there for you. It comes back to educating the customer. Many marketing messages used today for remote vibration analysis programs never really dig into the communication part of successful programs.
When you talk with the salespeople, communication isn’t emphasized. Most want to tell you how much they will save you and how they can do everything for you so you don’t tie your local tech up doing the route collection and analysis. The tradeoff is that I can use my local resources better and send them to machines that show changes.
Diagnosing Coupling, Bearing, and Structural Issues
When I ask for additional inspections because I am a remote vibration analyst, the first thing that comes to mind is rotating and structural looseness.
Inspection Techniques for Bearings and Shafts
Think about rotating looseness and running speed harmonics in a remote vibration analysis program. When I see this pattern developing in my vibration data, my typical recommendation is to check the bearing and shaft fit with a strobe light. Verify bearing set screws are correctly torqued.
Both are easy to check, but if I were running a route-based vibration analysis program, I would have already checked the bearing to the shaft fit when I was at the machine. If someone were collecting data with no tools, they would have to make a second trip once they get a strobe from the office or truck.
Here’s a way to track early bearing looseness. When the machine is down, shaft mark your bearing or attached part with a paint mark from the bearing/part to the shaft. Figure 4 shows a bearing marked on the left and a deflector to keep heat away from the bearing on the right. As soon as this line starts to creep, you will know it by conducting a quick strobe inspection.
Even when the machine is offline, a visual inspection will reveal the shaft slipping once creep begins. The exact process will work on monitoring bolts and nuts that develop looseness.
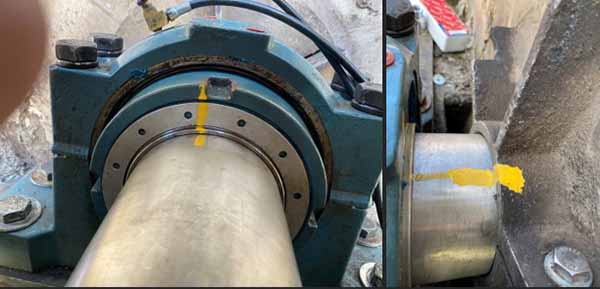
Figure 4: Bearing marking.
Assessing Structural Integrity and Weld Failures
When I see increases in the vertical or horizontal direction at running speed. My typical recommendation for a remote vibration monitoring program is to check the machine for cracked welds, broken supports, or missing bolts.
When I am running my portable routes, I will check for these at the machine while there, and my recommendation will be to repair the cracked weld and broken support brace or replace the missing bolt. If I can mark the issues, I will also use my paint marker to help show the location.
This will also include a photo of the problem that needs to be repaired. Figure 5 shows a cracked bearing mounting sole plate weld. Figure 6 shows a broken weld on the left and a missing bolt on the right.
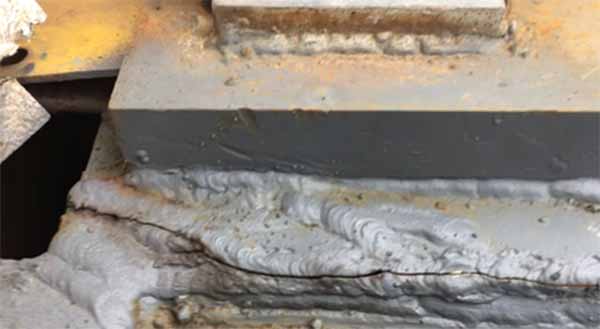
Figure 5: Cracked bearing mount weld.
Figure 6: Fractured weld and missing bolt.
I have written up many seal leak issues while doing route-based work. One was a pump product seal leak, with a seal pot on a pump. I checked to see if it was leaking. Figure 7 shows an indication of a leaking mechanical seal. The seal pot was set up to fill when the levels got low.
You can see the check ball floating and not seated, so the pot is low, and fluid is sent to the pot to keep the correct levels. While there, I could let the site know there was an internal or external leak. There is an external leak if the ball is not seated and water is on the floor or around the pump shaft. If the ball is not seated, and there is no water on the floor or around the shaft, a seal is leaking internally.
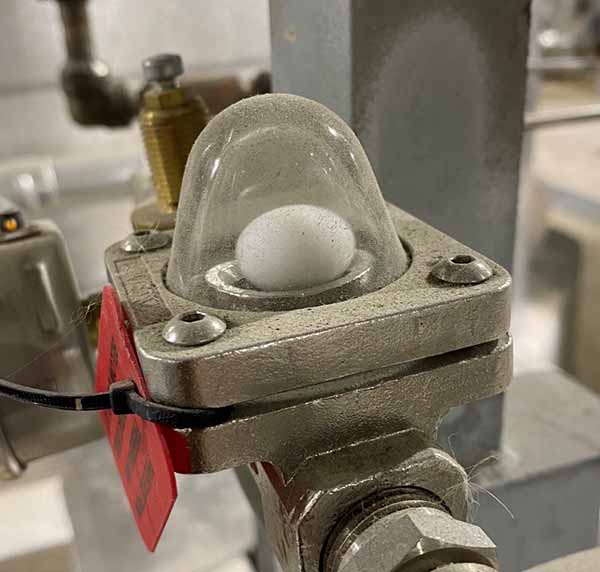
Figure 7: Indication of a leaking mechanical seal.
Equipment-Specific Diagnostics and Remote Monitoring Challenges
How about an increase of three times running speed? If I know we have a LoveJoy coupling, we know it could be related to either a coupling hub or a damaged spider. The square in Figure 8 shows a damaged spider, but it is hard to see the gap. The circle shows the damaged hub, indicated by the yellow arrow. The recommendation would be to replace the coupling hub and spider because of wear and damage. The photo will be attached to the work request.
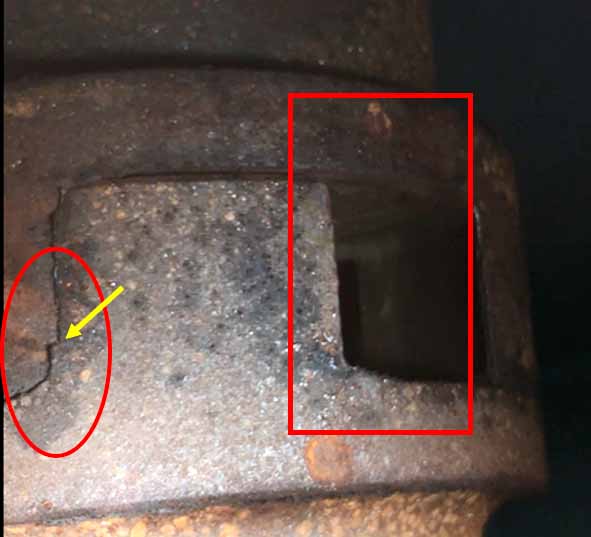
Figure 8: Damaged coupling spider.
This LoveJoy issue brings up another point, which is knowing your equipment. If the motor has a bearing with eight balls or rollers, these bearings typically have outer race frequencies slightly over three orders. You need to know the machine speed to separate the coupling issues from the bearing issue.
You must also have the resolution set up correctly to separate these two peaks. Some will say an early bearing issue will show up in the upper frequencies better than the coupling wear will, which is sometimes, but not always true.
Stroboscopic Inspection for Advanced Coupling Faults
What if I saw an increase in vibration at five or six times the motor’s running speed? When running a portable route, and I know I have a wrap flex style coupling with five or six ears, I can strobe the coupling (Figure 9) and see the insert coming out. When I have a remote vibration analysis program, I have to request that someone inspect the coupling area.
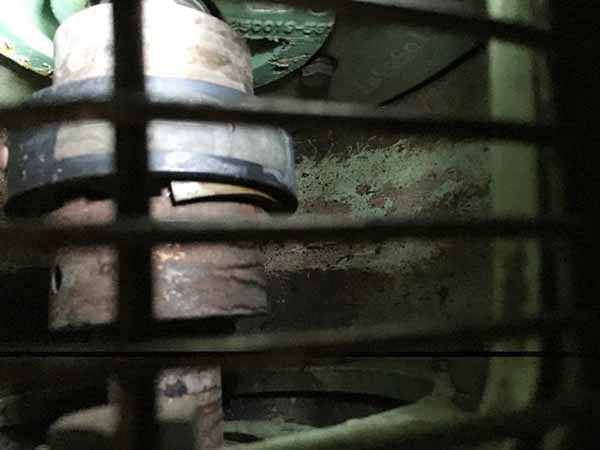
Figure 9: Coupling insert displacement.
Early Detection of Coupling Element and Belt Failures
Figure 10 shows an early-stage Omega coupling element failure on the left in the red circle. I found this during a portable vibration route. The running speed vibration had not started to change at this time, but the defect was there. Recommendation: Replace the coupling element the next time the machine is down.
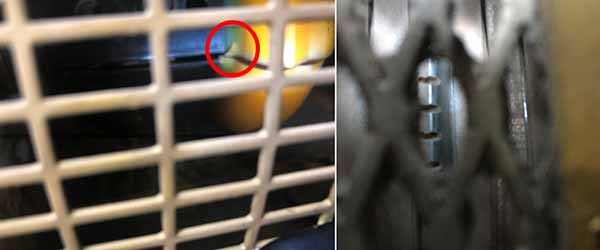
Figure 10: Early-stage coupling element failure.
The image on the right shows a belt that was flipped, but it was still running fine. The recommendation was to repair the belt the next time the fan was down with this image attached. If this was part of an online program, we may have noticed something during the run-up to the belt flip.
As it was on a monthly route, the vibration did not show many changes over time. Then, they were monitored for increases until they were replaced—a plus for the route program in these 2 cases.
Recognizing Temperature Trends and Silent Faults
In this remote vibration monitoring instance, the temperature on the motor vibration sensors was trending up. In Figure 11, you can easily understand why. If running a route-based vibration program, I could easily take this photo and attach it to my recommendation to clean the motor cooling fan cover and inspect it for damage.
In the remote vibration analysis program, I recommend inspecting the motor cooling fan cover and motor for buildup that decreases airflow over the motor. In this case, the motor temperature could also increase if the product covered the motor.
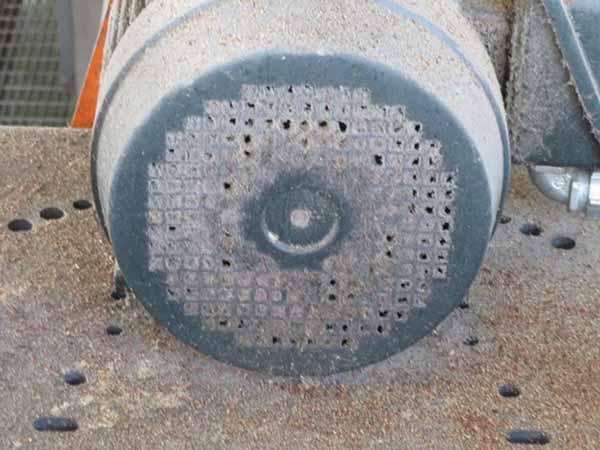
Figure 11: Blocked electric motor cooling fan cover.
Uncovering Hidden Faults in Vibration Monitoring Data
Regarding the motor in Figure 12, I have no idea what happened, but the vibration did not show any changes over time. The overall levels were below 0.225, where my alarms were set. There is an obvious issue here, but I would have no idea this condition existed in a remote vibration program.
On a side note, this motor ran this way for a couple of years, and the site accepted the risk of failure. If it had failed, would that be considered a miss by the vibration program? I would never know about this issue if this were part of a remote vibration program.
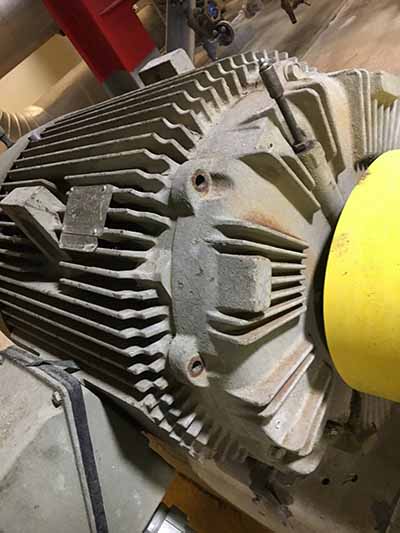
Figure 12: Missing bolts in electric motor end shield.
At several sites, maintenance technicians have expressed frustration when I return, claiming that the new online system isn’t as effective as my old route-based approach. When I ask for details, the typical response is:
“When you were here, your reports told me what I needed to do. Now I get requests to just go out and look at things. We are busy and do not have that much extra time.”
I will typically talk with them about inspection requests that operations or planners can make. This is a perfect opportunity for communication and education. We also discussed that at least the requests should point out what to look for. Think about this: If we monitor 200 machines, we are not asking you to inspect them all, just the ones showing changes now. That way, we can make better use of the limited time we have available.
Advantages of Continuous Vibration Monitoring
By monitoring 24/7, we pick up issues that may go unnoticed because they happened for a while, and then the vibration drops back to normal levels. By seeing these changes, we may also pick up new issues that once went unnoticed.
In one example, during a process change, the vibration jumped because, for some time, we were deadheading a pump, which damaged the seals. Without online monitoring, all we would have known in the past using portable routes was that we had a seal leaking.
Maybe the vibration jumped and never dropped back down and remained high, but with the online system, we can better understand when it happened. Perhaps the vibration in a pump jumped, and when we look at the time it jumped, we know that a strainer in the system failed at that time based on operation notes in the logbook.
So, we may have a chunk of raw product in the pump impeller. If we were using the portable route process, all we may know is that the running speed vibration dramatically jumped this month. It may have been bad enough that it caused the pump to fail. I have also seen times when the bearing temperatures jump. Now we know when it happened. We can review process notes to see if the changes are related to the temperature increases.
Comprehensive component data is essential for predictive maintenance and minimizing downtime.
Another thing I am passionate about is knowing my machine components and keeping that information current. The more data we have on the components, the better either program will work. The more of this data we have will help eliminate some of the inspection requests.
For example, I have a pump showing an increase at two times running speed. Pretty simple. We have a misalignment issue developing. If I had the machine data, I would know I have a 2-vane impeller, and the system has strainers. The change is related to recirculation. Instead of checking the alignment and being told there was no issue, I requested they check the strainers for plugging and the valves for proper settings.
Balancing Remote Monitoring with On-Site Inspections
Effective communication is crucial when transitioning from a portable vibration program to an online vibration system or launching a new online monitoring initiative.
We must emphasize the importance of scheduling periodic inspections—just like the examples discussed—and ensuring clear communication to gather critical machine component details. Some of this essential information, such as fan blade or belt sheave sizes, may only be obtainable when the machines are offline.
When establishing or transitioning to an online vibration monitoring program, addressing these topics upfront is essential to set realistic expectations.

Mark Kingkade is a Reliability Solutions Architect for Waites Wireless with over 30 years in Maintenance and Reliability. A CMRP since 2008, he has presented at multiple conferences on vibration analysis. His experience spans roles as Field Analyst, Lead Analyst, SME, and millwright planner. An ISO Cat 3 vibration analyst, he also works with oil analysis, thermography, ultrasonics, and more. He has supported 45+ PDM programs, developed inspection procedures, and optimized PM strategies. Passionate about mentoring, he helps others grow in condition monitoring.