There is often discussion about how soon faults can be detected by different technologies and success postings of those technologies showing catastrophic failures as victory detections.
This is where it is important to consider the differences between anomaly detection, band detection, and spectral analysis with high resolution.
Detecting an issue well ahead of the catastrophic condition allows a company to plan repairs during scheduled shutdowns or shutdowns where multiple conditions may be addressed. This requires, in order:
- Soonest: high-resolution spectral analysis with proper placement of transducers and alarms. The challenge is the proper detection of running speed.
- Next: band alarm detection with proper placement of transducers and alarms. Less resolution is required, but some faults may fall under the radar until later stages.
- Latest: anomaly detection with proper selection of data and proper alarm settings. Too tight results in high false positives, and too loose results in detection at failure.
The other area of concern from a reliability standpoint is the focus of most companies on fault detection, in which corrective action is required. Instead, the focus should be on the driving forces behind these types of conditions, dealing with them ahead of defects.
Expert systems like Electrical Signature Analysis excel in pinpointing defects and uncovering the driving forces behind them.
Expert systems still excel in these areas, including specific alarm limits, Electrical Signature Analysis (ESA), Motor Current Signature Analysis (MCSA), vibration analysis, ultrasound, motion amplification, etc.
However, most anomaly detection systems must first evaluate for condition and then be trained, as most training systems will only identify changes from existing conditions. That means if a system is trained with data on bad equipment (i.e., failed bearings, misalignment, etc.), it will only identify if that condition changes.
When used in a hybrid expert/AI (or hybrid ML) system, you can early-identify, monitor changes, perform time-to-failure estimation on failing conditions, and identify conditions that would initiate defects.
Management would then have options from mitigating potential failure to tracking conditions and projecting the risk of operating for different lengths of time.
This article will examine two case studies on applying ESA/MCSA to detect defect conditions and the result of the corrective actions using an expert system. One will be a pump system, and one will be a wind turbine application. In this case study, we will focus on data collection with future articles covering variations of the other types of ESA/MCSA.
Electrical Current Signature Analysis Case Study 1: Pump System Before and After Analysis
The pump system shown in Figure 1 was evaluated in 2023 and is an 800 horsepower, 890 RPM, 4000 Volt, 105 Amp motor. Data was collected with an EMPATH ESA data collector from the back of the motor relay system from Current Transformers (CTs) and Potential Transformers (PTs) with ratios entered into the software (Figure 2).
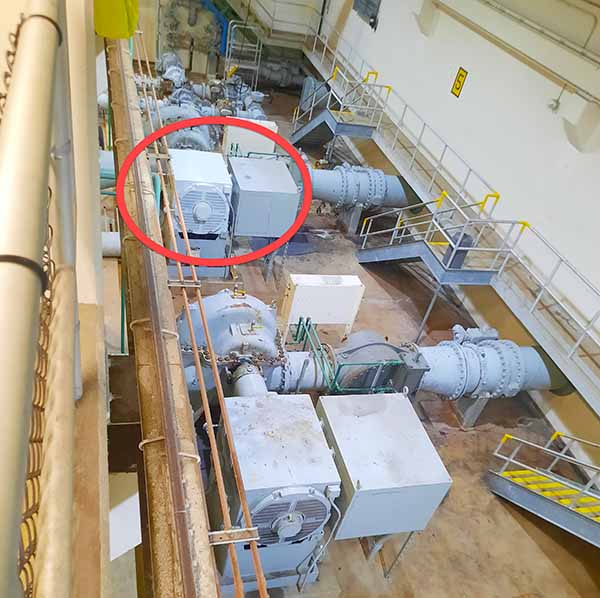
Figure 1: Pump motor after corrective actions
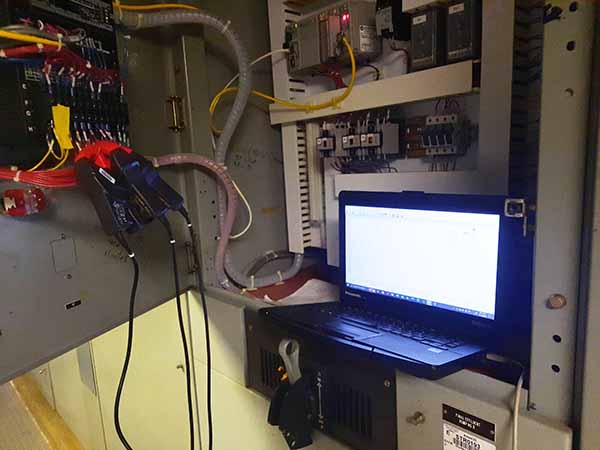
Figure 2: MCSA of pump motor after corrective actions with EMPATH.
With the initial test, the motor was found to have misalignment (Figure 3) with offset, which is identified as slight dynamic eccentricity (Figure 4) and 1X RPM.
There is also some static eccentricity, which, combined with the other findings, indicates that the Babbitt bearings require attention (mixed eccentricity). The motor was sent for basic overhaul and bearing inspection/repair, and each identified condition was found and corrected.
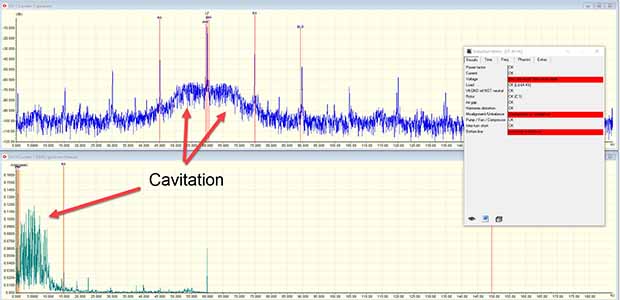
Figure 3: EMPATH data showing misalignment and cavitation (low frequency 0.01 Hz resolution).

Figure 4: High-frequency current and voltage spectra showing dynamic eccentricity peaks, electrical data, and machine efficiency.
The overall misalignment losses in 1X, dynamic and static eccentricity, and cavitation came to a total of 3.9 kilowatts or 1% of the total load and 5% of the total motor losses (1.2kW of 22kW).
The motor was removed, repaired, reinstalled, and hot-aligned, and corrections were made to reduce cavitation. Both current and electrical signature analyses were collected following the repair and reinstallation.
It was found that the motor was still misaligned, requiring further work (confirmed following testing), but the data associated with worn bearings was eliminated. Losses, including cavitation, totaled 1.8 kilowatts at a similar load.
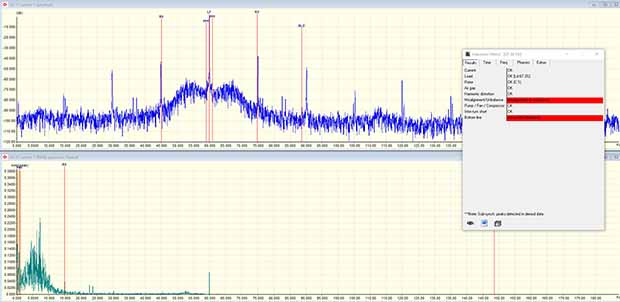
Figure 5: Slightly improved cavitation and alignment.
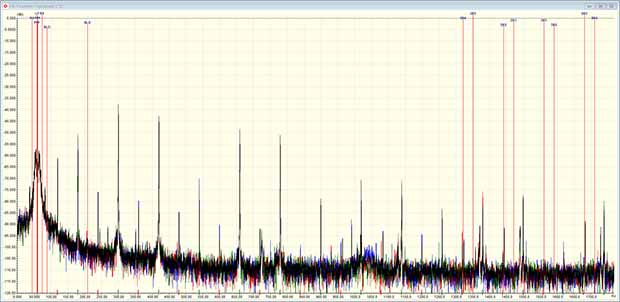
Figure 6: Remaining dynamic eccentricity from alignment, static eccentricity gone.
Even with additional work required, a reduction of 2.1 kilowatts with a motor that operates 8,760 hours per year results in an 18,396 kWh reduction in electrical usage and, using the national average of 0.699 metric tons of CO2/MWh, 12.9 mTCO2. An additional 876 kWh and 0.6 mTCO2 can be avoided with the alignment, in addition to wear and tear on the bearings.
Electrical Current Signature Analysis Case Study 2: Wind Turbine Bearings
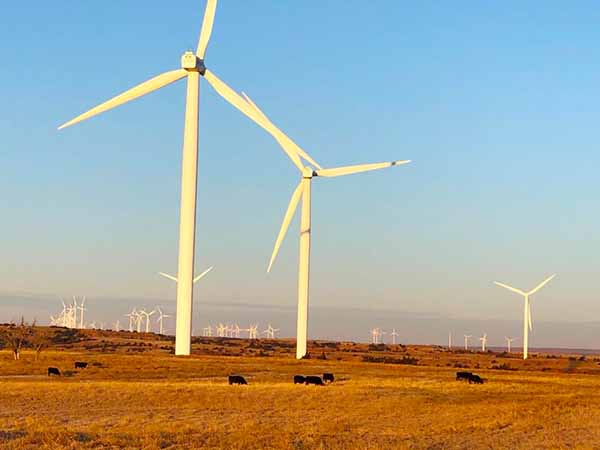
Figure 7: 1.6 megawatt wind turbines on a ranch. The closer one on the left is the turbine evaluated.
The drive end bearing on a 690 Volt, 1.6 megawatt (MW), 6-pole (1200 RPM) asynchronous doubly-fed induction generator (DFIG) (Figure 7) was replaced due to a failure of the original 6330M bearing. These bearings have the outer race coated with ceramic to protect against shaft currents.
After installing a new DE bearing, EMPATH ESA data was collected, a defect was found, the bearing was replaced, and a final ESA data was collected and compared to the original data. The before and after data were tested at the same speed and load for the comparison. Data was collected at the tower’s base (no need for the ~300 ft vertical climb for testing).
Figures 8, 9, and 10 are of the condition of the wind turbine generator and powertrain after the initial bearing replacement. The red arrows indicate where several conditions exist (voltage signature analysis), and the blue arrows indicate gearbox planetary gearbox defects between the planet and ring gears.
These are due to the unbalanced loading of the planet gears and misalignment between the carrier and main shaft, which will eventually cause failure of the associated gears.
Figure 10 relates to the detection of the defects in the bearing. In ESA and MCSA, bearing defects show as 1X the bearing defect signatures, unlike in vibration, where there may be harmonics of bearing defect signatures.
As a result, it is normal to only look for the bearing component times rotating speed. In this case, the ball is 107.8 Hz, the outer race is 132.4 Hz, and the inner race is 169.2 Hz. These use the same multipliers as vibration analysis, which are multiplied by either RPM or Hz.
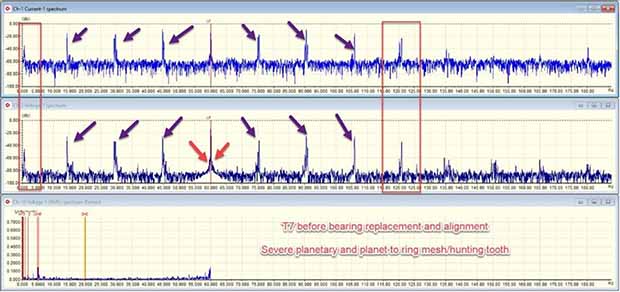
Figure 8: Low-frequency data set showing gearbox conditions.
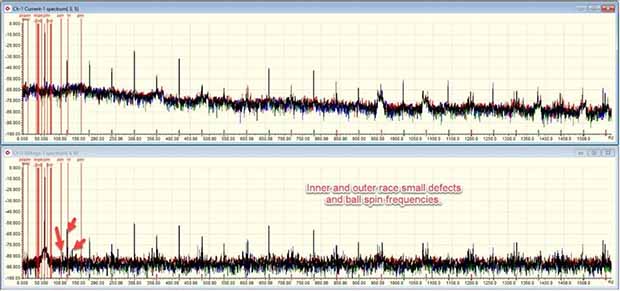
Figure 9: High-frequency data set zoomed and showing defect frequencies.
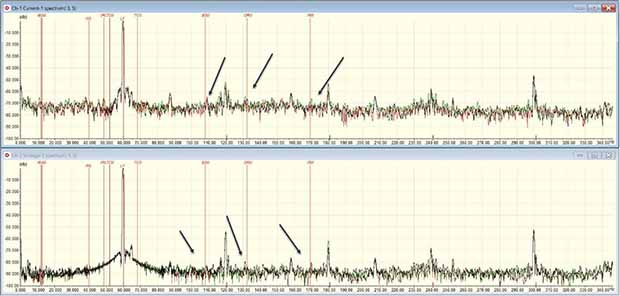
Figure 10 Bearing defect signatures. We are looking at 3-5 dB above the noise floor for early detection.
In addition to detecting the DE generator bearing, a peak was identified that was associated with the gearbox’s high-speed (generator side) thrust bearing.
The conditions were compared to the energy losses for each of the bearing components (Figure 11), with the thrust bearing outer race showing 8.6 kW losses, the DE bearing showing 1 kW ball, 1 kW outer race, and 0.4 kW inner race losses for a total of 11 kW bearing losses. The high thrust bearing loss was investigated, and a spacer was found to be left out of the coupling.
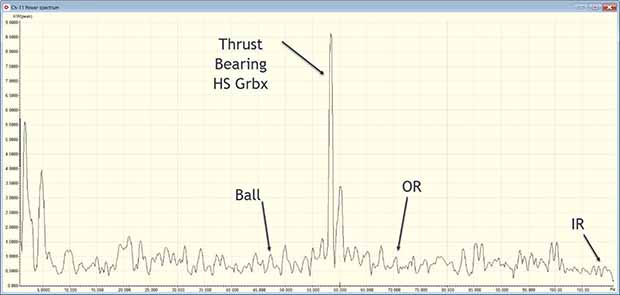
Figure 11: Bearing losses. Other losses are present but not the focus of this case study.
The bearing was sent to MotorDoc LLC for analysis with the inspections shown in Figures 12, 13, 14, and 15.
Figure 12 shows the bearing as packed with the balls removed to eliminate false positives associated with false brinelling, Figure 13 shows the inner race with false brinelling, Figure 14 is of the outer race with false brinelling, and Figure 15 is of one of 2 of the balls that had started dragging.
The cage was not included as it was altered during the removal process when the balls were being preserved. It is expected that the false brinelling had occurred before the bearing installation.
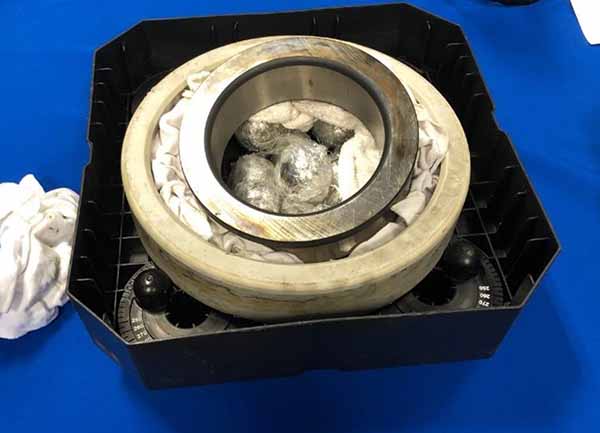
Figure 12: 6330M bearing with ceramic coating on the outer race.
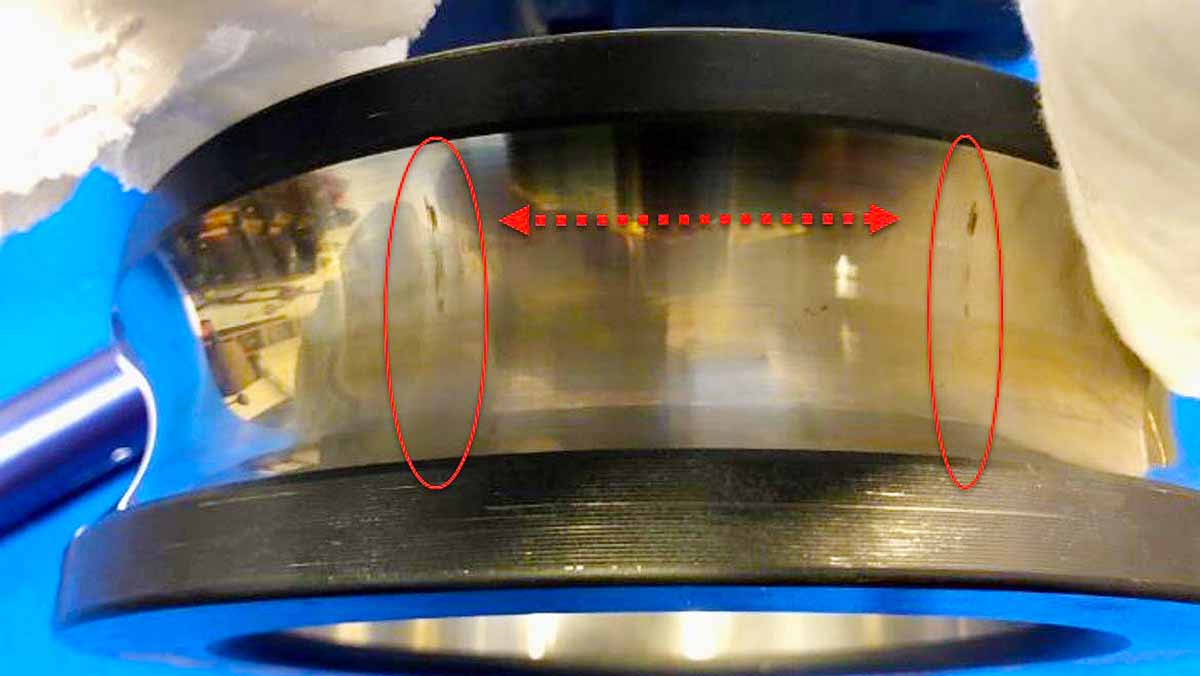
Figure 13: Inner race of the bearing with false brinelling. The red arrow shows the ball’s path.
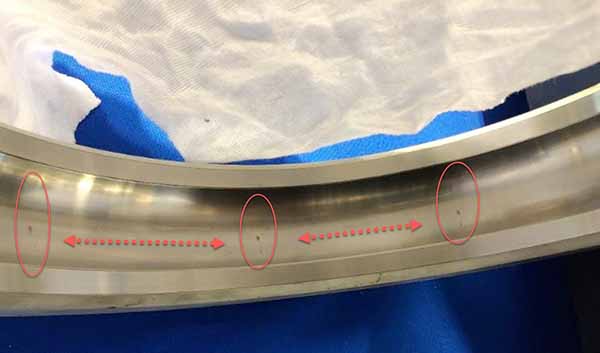
Figure 14: Outer race false brinelling. Arrows show the ball’s path.
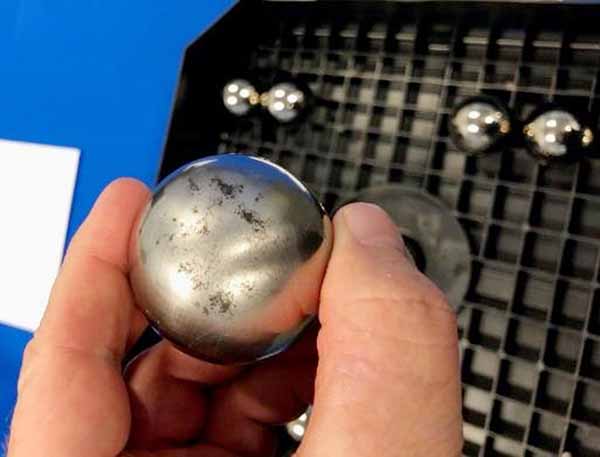
Figure 15: One of several balls that were not rotating correctly, resulting in damage. It should be a shiny finish similar to the balls in the background.
After the new bearing was inspected and installed, data was collected at the same speed and load. Figures 16 and 17 show each component’s bearing signatures and energy losses after the bearing was replaced.
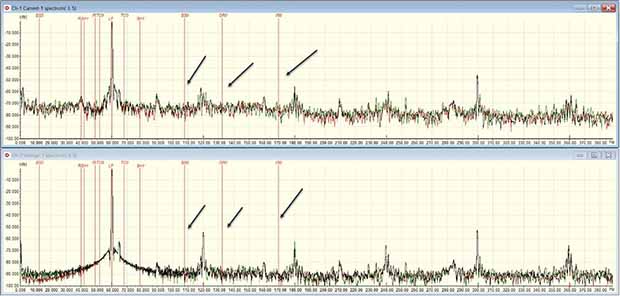
Figure 16: Generator DE bearing frequency locations.
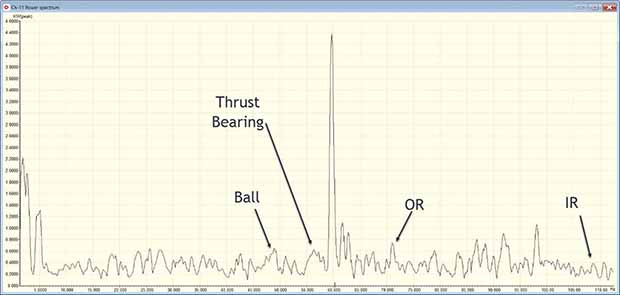
Figure 17: Bearing losses after DE bearing replacement.
As shown in Figure 17, the losses dropped once the bearing was replaced and the coupling was properly installed and aligned. Gearbox and other conditions were not addressed during this repair.
The thrust bearing loss dropped to 0.65 kW (650 watts), the ball to 0.65 kW, the outer race to 0.74 kW, and the inner race to 0.39 kW with total losses of 2.43 kW, which are in alignment for friction losses in this type of application with the type of bearing lubricant being used.
All of the defects were found with built-in algorithms, including a summary of losses, with an expert-system-based ESA system. Using a system analysis from ESA/MCSA allows for early detection of defects, combined with component loss analysis, severity, and fault pinpointing.
Early detection with ESA systems not only pinpoints defects but also quantifies energy losses for precise corrective actions.
In the pump system analysis, a combination of conditions was found, and once corrected, a test was performed for quality assurance. It was determined that some of the corrective actions, including an alignment, were still found unsatisfactory, prompting the owner to request further rework.
In the wind turbine ESA was performed to evaluate the quality of a bearing installation by the service company to verify their work. The detection of the defect during a time that was convenient for the site owner and well ahead of a catastrophic failure enabled the service company to perform a less costly and contentious correction while benefiting from a bearing company warranty. The bearing manufacturer agreed to release the bearing for study, which benefited the bearing company, service company, and site owner.


