Over the past few years, some incorrect information has been provided, resulting in standards and trade articles associated with Electrical Signature Analysis (ESA) and Motor Current Signature Analysis (MCSA) being misleading. One of these concerns appears to be based on the assumption that load impacts ESA/MCSA decibel (dB) amplitude in a similar manner as vibration analysis.
In vibration analysis, rotating forces must pass through materials, and changes in load that change those forces will directly impact vibration amplitudes. This is not the same case as with ESA/MCSA, which is a relative value between the peak current and associated defect currents in the machine and powertrain both radially and torsionally.
The equation below provides the relationship for -dB current, for instance. So, if we have a low load of, say, 10 Amps on a 50 hp motor with a defect value of 0.1 Amps, then when the machine is loaded up to 60 Amps and the defect frequency increases to 0.6 Amps (increased force), then we have -40dB at no load and -40 dB at the higher load, but this would represent a greater force in vibration.

Where Af is the current at the frequency in question and Ap is the current at the primary frequency.
In an induction machine, the frequency location of the dB peak becomes a concern as it will shift with the change in slip, and we will also see harmonics related to voltage and current. It becomes very easy for the peaks in either voltage or current to blend in with harmonic peaks depending on the resolution of the spectra.
The challenge in obtaining good data includes the size of the data set and the length of time for data collection. In this article, we will review data collected at 110 seconds at 44.1kHz, 24 bit (sound), then pulling out 60 seconds and 30 seconds on a loaded 350 hp, 1785 RPM motor and no load with a 750 watt, 1780 RPM electric motor. At each point we reduce the resolution, which is a similar manner as with vibration analysis.
Evaluating Data Resolution and Load Effects on a 350 HP Motor’s Performance
A 350 hp, 1785 RPM, vertical motor had data collection obtained with an EMPOWER™ MCSA system at 110 seconds, 44.1 kHz, 24 bit as a WAV file. The motor was operating across the line at 67% load, which resulted in a loaded running speed of 1794 RPM. Data analyzed at each frequency range resulted in lower resolution as time was restricted.
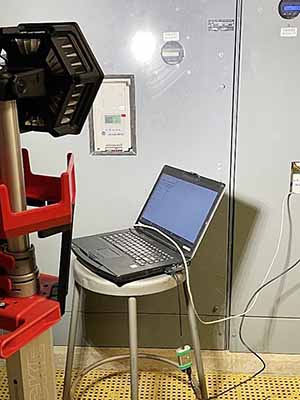
Figure 1. Data collection at motor control center with EMPATH and EMPOWER systems
The resulting data can be found in Figure 2:
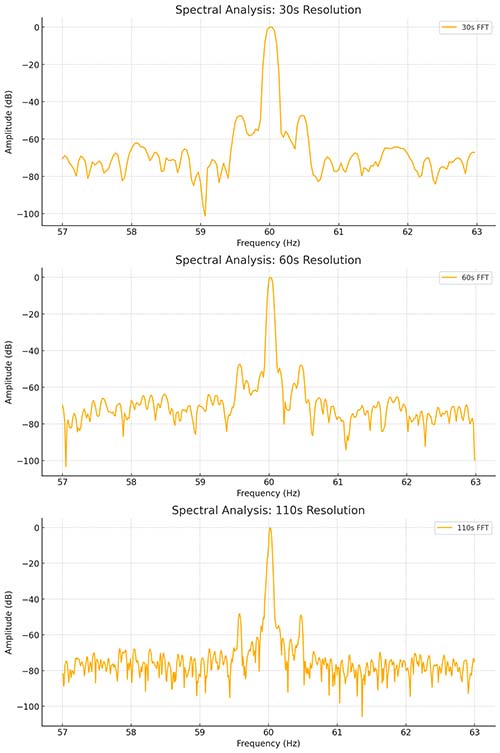
Figure 2: Comparison of spectral resolution near line frequency.
Under heavier loads, when you have good slip, where the motor is falling behind the synchronous magnetic field speed, you generate a separation between the harmonic peaks and the running-speed-related peaks.
These frequencies can blend at lighter loads when the resolution is not great enough. In Figure 2, the resolution at 30 seconds is 0.0333 Hz (bin size), at 60 seconds is 0.0167 Hz, and at 110 seconds is 0.009 Hz.
The challenge with resolution, also referred to as bin size, is that all of the related values in each bin are presented as part of each peak. The resolution is determined by the sampling frequency and the number of points (N) in the FFT as Resolution = (frequency/FFT points).
So, if 1000 points are collected and 500 FFT points are utilized, then the resolution would be 1000Hz/500 = 2 Hz. The resolution is improved by increasing the sampling time or sampling time. In the case of the data above, the total points are shown in Table 1.

Table 1: Total points for analysis.
The sampling value is divided by the Total Points resulting in the resolution. In addition, the use of Nyquist 2 results in the resolution across 44,100 Hz/2 = 22,050 Hz FMAX (length of spectra).
750 Watt Horsepower No Load Example
A small motor on a VFD operating at 50 Hz at no load was evaluated. The running speed was determined as 1496 RPM, which is a Pole Pass Frequency of 0.13 Hz. This appears as shown in Figure 3, which is based on Table 1 resolution values.
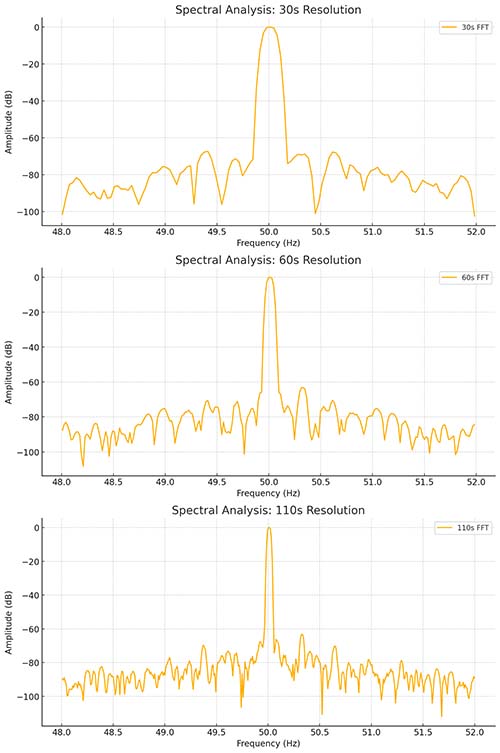
Figure 3: No load resolution comparisons.
As can be observed, some peaks that are close in on the line frequency then blend in and other peaks with close sidebands become absorbed with the primary peaks.
Understanding the Impact of Resolution on ESA/MCSA Accuracy and Clarity

Figure 4: 750 Watt Motor at No Load on VFD Pole Pass Frequency with 110 seconds at 44.1 kHz sampling.
As noted in Figure 4, there are peaks definitively showing PPF peaks and its harmonics. For a machine of this size, it would indicate that there are multiple circuit interruptions in the rotor conductors.
At 110 seconds at no load on a VFD, the resolution is ~0.009 Hz, giving us room to analyze if the motor operated even closer to synchronous speed. However, if we have a lower sampling rate and/or a lesser length of data collection time we could end up with Figure 5.

Figure 5: 750-watt motor at No Load on VFD PPF at 30 seconds with 44.1 kHz sampling.
The change in resolution has two impacts in this case. First, the PPF blends in with the line frequency peak, and second, the harmonics of the PPF blend in with each other.
Misunderstandings of the differences between Electrical Signature Analysis (ESA) and Motor Current Signature Analysis (MCSA) manufacturers and how they collect data have resulted in incorrect statements made in a combination of trade magazines and one mention in a standard that impacts all ESA/MCSA instruments.
The amplitudes of ESA/MCSA are not the same as with vibration as they involve a direct relationship and ratio within the magnetic field of a machine such that any differences have minimal impact on the type of measurement displayed, which is normally in dB values.
Variations between instrument manufacturers depend on whether they use dB values and the types of filtering, averages, and windows used. The second concern associated with the load is the resolution of the device used.
For electric machines that are lightly loaded, you will need a test system with a higher resolution. This is achieved either through increasing the sample rate the amount of time, or both. In the case of the higher resolution (110 second) data in this article, the combination of 44.1 kHz and time results in an accuracy of 0.009 Hz.

