Recently, an article was published by a trade magazine that suggested that ESA could do a complete electric motor and powertrain, while MCSA was limited in identifying that a problem existed somewhere in the electric motor only.
In other cases, several companies have determined that they perform ESA and/or MCSA with the outputs and analysis associated with power quality only. However, Electrical Signature Analysis (ESA) combines voltage and current data, providing detailed spectral analysis of both and other calculations such as airgap torque and watts.
Understanding Electrical Signature Analysis (ESA) and Motor Current Signature Analysis (MCSA)
While, by definition, an ESA system is also a power analyzer, a power analyzer is not an ESA device. Motor Current Signature Analysis (MCSA) and Current Signature Analysis (CSA) are defined as a system that takes at least one phase of current and performs a spectral analysis on the current.
These are defined in ISO 20958-2013, “Condition Monitoring and Diagnostics of Machine Systems – Electrical Signature Analysis of Three-Phase Induction Motors,” as “Current Signature Analysis – spectral analysis performed on the line current to the motor to determine if there are currents at specific frequencies that can indicate component defects.”
ESA definitions are limited in the standard. However, the overall document leaves much to be desired as the original work was dropped between 2008-2010, and the original group that performed ESA and MCSA was left out.
The result was a very limited representation of the industry left to one MCSA single-phase manufacturer and some academics versus the established commercial systems that have been available since the early 1990s.
In “Current Signature Analysis of Condition Monitoring of Cage Induction Motors” (2017, Wiley Press), authors William Thomson and Ian Culbert identify Current Signature Analysis as primarily being focused on rotor bars and air gap problems. There is limited suggestion of the ability to evaluate mechanical systems such as bearings and driven components.
In “Practical Electrical and Current Signature Analysis of Electrical Machinery and Systems” (2022, SBD Press), author Howard Penrose discusses the in-depth ability of ESA to see incoming power, power generation, and transformers and both ESA and MCSA to identify electrical and mechanical conditions of the electric machine and driven equipment.
This includes bearings, belts, alignment, unbalance, gears, etc., as was initially identified by Howard Haynes (Oak Ridge National Labs) in the 1980s, the father of modern ESA, defined ESA in his 1989 paper, “Electrical Signature Analysis (ESA) Developments at the Oak Ridge Diagnostics Applied Research Center,” as follows:
Since 1985, researchers at the Oak Ridge National Labs (ORNL) have developed and patented several novel signal conditioning and signature analysis methods that have exploited the intrinsic abilities of conventional electric motors and generators to act as transducers. By using simple nonintrusive sensors such as clamp-on current and voltage probes, these new diagnostic techniques provide an improved means of detecting small time-dependent load and speed variations generated anywhere within an electro-mechanical system and converting them into revealing ‘signatures’ that can be used to detect equipment degradation and incipient failures.
The technology uses the magnetic field between the rotor and stator as the transducer. As a result, both the rotor’s radial movement and the rotor’s torsional impact from driven loads impact the current waveform, which has some effect on voltage.
Voltage indicates incoming power conditions and can be used to separate the machine being evaluated from other machines in the system. When converting voltage and current values to decibels with the peak set at ‘0 dB,’ alert and alarm levels can be determined by counting down to the associated peaks that are calculated much the same way as vibration analysis, with only a few exceptions.
This was understood in 1990 when NAVSEA published a study on “Current Analysis for the Condition Assessment of Shipboard Motor Driven Machinery” (Tate, Nemarich, and Porter, MFPT, 1990) where different electric motor-driven equipment was evaluated along with the driven machinery, such as pumps and compressors. Somewhere along the way, the focus fell back to rotor bar and airgap analysis only.
Case Study: 350 HP Motor Compare ESA Spectra to MCSA Spectra on Inverter
We will start by comparing ESA and MCSA using two different methods. The first is with an EMPATH ESA portable unit, and the second is an EMPOWER MCSA single-phase current tester. One will be on a 350 hp, 460 Vac, 1785 RPM motor on an inverter, and the other will be the same type of motor operating across the line (Figure 1). The connections are shown in Figure 2.

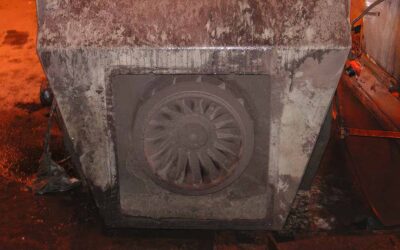
Figure 1: 350 HP vertical motor.

Figure 2: EMPATH and EMPOWER connections on inverter output.
The systems were run with the ESA system operating first and the MCSA system operating second. For this first set of case studies, we will not include the pumps (although no conditions were found) and will focus on the condition of the motor.

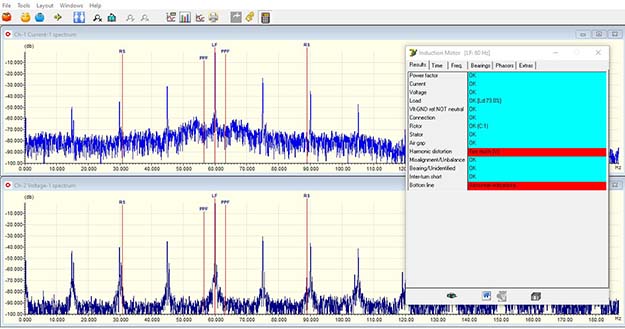
Figure 3: The automated analysis findings of the EMPATH system and the low-frequency voltage and current (0.01 Hz accuracy).

Figure 4: Higher frequency voltage and current spectra of ESA showing static eccentricity.
The data required 48 seconds of collection for the ESA system for Figures 3 and 4. The MCSA system in Figure 5 is the exact same motor with 120 seconds of data collection. This is to generate a spectra across 22 kHz of data, but only 5 kHz is displayed.

Figure 5: MCSA data and spectra, which are virtually identical to Figures 3 and 4. There are slight differences due to a different window system applied.
As noted, the MCSA system did not see the potential misalignment. This may be a power frequency artifact in the ESA system related to the VFD output.
Case 2: 350 HP Motors Across-the-Line
In both cases, the automated analysis of both systems identified the bearings and static eccentricity in an inverter in Case 1. In Case 2, the electric motors are the same type and size as in Case 1 but across the line. Figures 6 and 7 use an ESA system with the power supply having a fair number of harmonics present from the surrounding drives. The result is spectral artifacts.

Figure 6: ESA low-frequency spectra in voltage and current. Most of the peaks are harmonic and sub-harmonic power frequencies. The peaks under RS (running speed) in voltage are from the machine next to it.

Figure 7: ESA high-frequency voltage and current spectra showing harmonic content and artifacts.
The MCSA findings in Figure 8 are virtually identical to the current signatures in ESA. In this case, the settings we placed in the MCSA for bearing defects did detect a lubrication issue with the top bearing, which is oil-lubricated. Findings in the motor are similar between both the inverter and across-the-line applications.

Figure 8: MCSA-only testing. The filter applied here eliminated several power harmonic peaks.
Contrary to some recent articles, both ESA and MCSA are defined as spectral analysis of voltage (ESA) and current (ESA/MCSA), equally review the electric motor and driven equipment electrical and mechanical conditions.
ESA has the added benefit of providing power quality analysis and airgap torque spectral analysis to enhance the ability of electrical data to analyze a system.
In both cases, the technologies are similar to vibration analysis except that the airgap is the transducer (not the rotor or stator), and the results are seen as a result of the impact of defects on the radial and torsional components of the magnetic field.
Two case studies of an ESA device and an MCSA device were presented to show that the current spectra are virtually identical. With the exception of power quality and loose connections (in single-phase MCSA), the results are almost identical.


