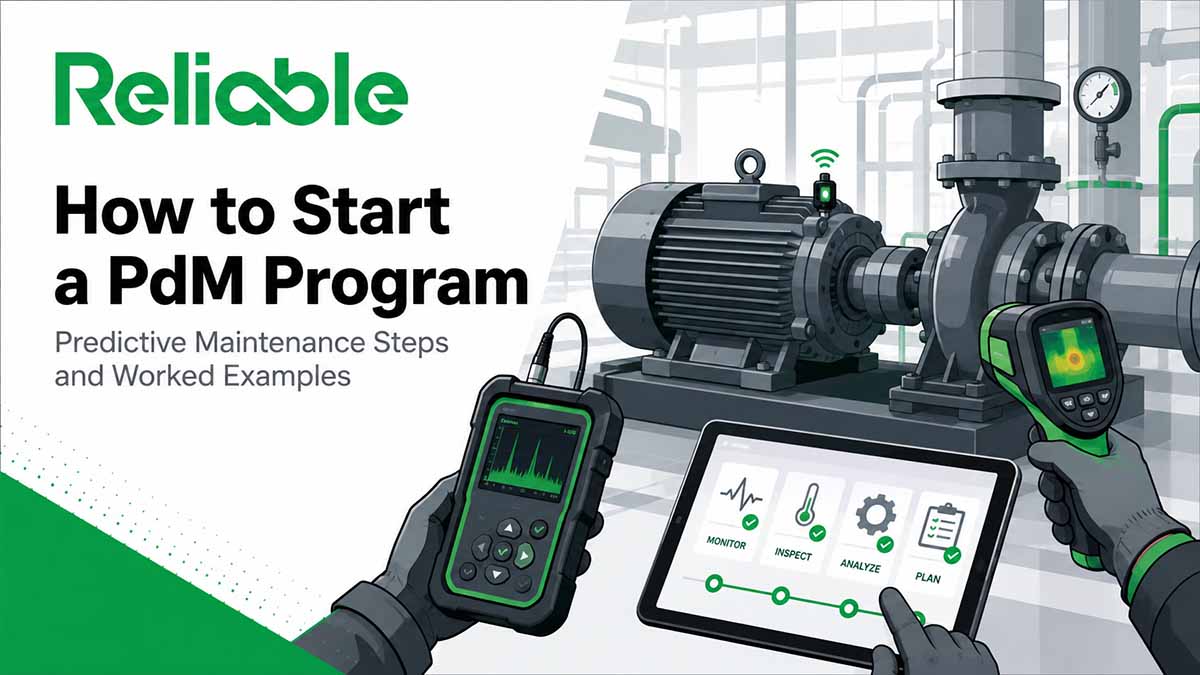
How to Start a PdM Program: Predictive Maintenance Steps and Worked Examples
Last updated: August 16, 2026.
The Short Version: A predictive maintenance (PdM) program uses condition monitoring to catch developing faults early, so repairs can be planned before failure. Begin with a narrow problem and a defined scope, then rank the assets by criticality and match monitoring techniques to the failure modes that actually occur.
Set baselines and alarm limits, choose inspection frequencies that fit each failure's warning time, and assign clear ownership for data and follow-up. Run a bounded first-wave pilot on a small set of critical assets before scaling.
PdM detects developing faults, and the value shows up only when those findings turn into scheduled work and verified repairs. Build the detection-to-work-order loop from day one.
Reliable Magazine is independent. We do not sell PdM software, sensors, monitoring services, or training, and no vendor paid for placement in this guide. The references below are government, national laboratory, and standards sources. Where a figure comes from a specific study, we say so and note its limits, because a program you are about to fund deserves numbers you can trust.
What is a PdM program?
Predictive maintenance, usually shortened to PdM, is a condition-based strategy. Rather than running equipment to failure or servicing it on a fixed schedule, a plant monitors measurable indicators of health and acts when those indicators show a developing problem. The U.S. Department of Energy Federal Energy Management Program describes predictive maintenance as scheduling work on the basis of the equipment's quantified condition, acting when measured indicators show that maintenance is warranted rather than on a fixed calendar or run-time interval.
A PdM program is the organized structure that makes those techniques repeatable and accountable: the assets in scope, the techniques used to watch them, the baselines and limits that define normal, the people who collect and interpret data, and the workflow that turns a finding into a completed repair.
Part of the rationale for condition-based methods comes from long-standing reliability research. In their 1978 study for the U.S. Department of Defense, Nowlan and Heap found that equipment failures follow several distinct patterns, and that for many items the correlation between age and failure is weak, which means fixed-interval overhaul is often the wrong tool. The NASA Reliability-Centered Maintenance Guide, which draws on that work, summarizes condition monitoring as one way to decide when maintenance is actually needed.
PdM techniques and the failure modes they catch
No single technique covers everything. Each one detects a limited set of failure modes, so the right starting mix follows from your asset population. The table below maps common techniques to what they detect and where they fit.
| PdM technique | What it detects | Typical assets |
|---|---|---|
| Vibration analysis | Imbalance, misalignment, bearing wear, looseness, resonance | Pumps, fans, motors, gearboxes, and other rotating equipment |
| Infrared thermography | Loose or corroded connections, overloaded circuits, hot bearings, insulation loss | Electrical distribution, switchgear, mechanical drives, building envelope |
| Oil analysis (tribology) | Wear particles, contamination, lubricant degradation | Gearboxes, hydraulics, large lubricated bearings |
| Airborne and structure-borne ultrasound | Pressure and vacuum leaks, early bearing faults, electrical arcing and partial discharge | Compressed air and gas systems, steam traps, bearings, switchgear |
| Motor current and electrical testing | Rotor bar, insulation, and winding faults | Electric motors |
| Non-destructive testing and thickness monitoring | Wall loss, cracking, corrosion | Pressure vessels, piping, tanks |
ISO 17359:2018 sets out general procedures for condition monitoring and diagnostics of machines, so it serves as a general framework for structuring a program rather than the complete body of condition monitoring guidance.
How to start a PdM program, step by step
Define the problem and the scope
Write down the specific problem the program should solve and the assets it will cover. A narrow, concrete goal, such as reducing unplanned pump failures in one area, is easier to resource and measure than a plant-wide ambition. A clear scope keeps the first effort finishable.
Rank assets by criticality
Rank the in-scope assets by the consequence of their failure, considering safety, environmental risk, production loss, and repair cost. Criticality ranking directs monitoring effort toward the assets where early warning is worth paying for, and it keeps analyst time off equipment that is cheap and quick to replace.
Match techniques to failure modes
For each critical asset, identify how it actually fails, then choose monitoring techniques that detect those specific failure modes. Rotating equipment points toward vibration analysis, electrical connections toward thermography, lubricated drivetrains toward oil analysis, and pressure equipment toward thickness monitoring. A failure mode with no economical detection method is a candidate for a different maintenance strategy.
Set baselines and alarm limits
Collect readings under normal, healthy conditions to define a baseline signature for each asset, then set alarm limits as deviations from that baseline. Published vibration guidance, such as the evaluation and classification criteria in ISO 20816-1, gives a starting point that must be tuned to the specific machine and its duty rather than a complete alarm-setting method. Expect baselines to need refinement during the first months.
Choose inspection frequencies that fit the warning time
Set how often each asset is checked based on how quickly its failures develop. In reliability-centered maintenance practice, the interval between the first detectable sign of a fault and functional failure is often called the P-F interval, and inspections must be frequent enough to catch the fault inside that window, with margin left to plan and complete the repair. Slow-developing faults tolerate periodic routes, while fast-developing faults may require continuous monitoring.
Assign roles, data ownership, and training
Name who collects data, who interprets it, who approves resulting work, and who verifies repairs. Reliable interpretation takes qualified people, which is why the ISO 18436 series defines competence levels for condition monitoring personnel. Deciding data ownership up front prevents readings from piling up with no one accountable for acting on them.
Run a bounded first-wave pilot
Launch on a small, high-criticality set of assets rather than the whole plant. A contained pilot lets the team test the full workflow, refine baselines and limits, and show results quickly, which builds the credibility needed to expand. Pick an area where failures are frequent or costly, so the value of early catches is visible.
Close the loop and measure results
Build the path from detection to work order to verified repair, and track whether findings actually prevent failures. Measures such as faults caught and corrected before failure, the ratio of planned to unplanned work, and avoided downtime show whether the program is working. A program that gathers data without closing this loop produces cost without benefit.
Worked plant examples
Worked example 1: a pump-heavy water plant starts with vibration
Suppose a municipal water treatment plant runs 40 process pumps, and three high-service pumps feed the entire distribution system. Failure of a high-service pump risks a supply interruption, so those three rank as high criticality.
The dominant failure modes on these pumps are bearing wear, misalignment, and imbalance, all of which vibration analysis detects well. The team selects route-based vibration monitoring for the three high-service pumps plus a handful of critical raw-water pumps, twelve assets in total.
They collect baseline readings during normal operation, set alarm limits as deviations from those baselines using the evaluation and classification criteria in ISO 20816-1 as a starting point that must be tuned to the specific machine and its duty, and choose a monthly route because bearing faults on these units typically develop over weeks to months. Each alarm triggers a defined workflow: confirm with a follow-up reading, generate a work order, plan the repair during a scheduled window, and take a post-repair reading to verify the fix.
Worked example 2: an electrical room starts with infrared thermography
Suppose the same plant wants fast, broad coverage of its electrical distribution. Loose and corroded connections in motor control centers and switchgear heat up under load before they fail, and infrared thermography can scan many connections quickly.
The team builds a thermography route covering the main switchgear, motor control centers, and transformer connections, scanning under representative load. Findings are graded by temperature rise over a reference point and by consequence, so a hot connection on a critical feeder is prioritized over a minor rise on a redundant circuit.
Because electrical faults can progress unpredictably, severe findings are acted on immediately rather than deferred to the next planned window. The route runs quarterly, with more frequent scans on circuits that have a history of problems.
Worked example 3: a gearbox fleet starts with oil analysis
Suppose a manufacturing site runs 25 large gearboxes on conveyors and mixers. Internal gear and bearing wear is hard to see from the outside, but it shows up in the oil as wear particles and changes in lubricant condition.
The team enrolls the ten most critical gearboxes in a scheduled oil sampling program, sampling from a consistent point during operation to get representative results. A laboratory reports wear metals, viscosity, contamination, and additive condition, and results are trended over time rather than judged on a single sample.
A rising trend in a wear metal prompts a closer look, often combined with a vibration check on the same unit, before any teardown. Sampling frequency starts monthly and is adjusted as each unit's normal signature becomes clear.
Honest limitations of a PdM program
PdM finds faults, and it depends on a corrective loop to be worth anything. Data that no one acts on produces no value, so the workflow from detection to verified repair matters as much as the sensors.
Reliable interpretation takes competent people. Poorly collected data and untrained analysis produce false alarms and missed faults, which is a large part of why competence standards for condition monitoring personnel exist.
Baselines take time. Early in a program, alarms can be noisy until the normal operating signature of each asset is well established, and some early findings will need review before they are trusted.
Not every failure mode is economically detectable. Some failures are sudden or effectively random, with no useful warning period, and PdM adds little there. Those assets may be better served by a different strategy.
Return depends on consequence. Applying PdM to low-criticality, easily replaced assets often costs more than it saves, which is exactly why criticality ranking comes before technique selection.
Coverage has a price. A single technique catches a limited set of failure modes, so broad coverage usually needs more than one technique, and continuous online monitoring adds sensor, wiring, and data-handling cost that has to be justified by the consequence of failure.
Frequently Asked Questions
What is a PdM program?
A PdM program is an organized way to monitor equipment condition and act on developing faults before they cause failure. PdM stands for predictive maintenance. It uses condition monitoring techniques such as vibration analysis, infrared thermography, oil analysis, and ultrasound to detect problems while the equipment is still running, so repairs can be planned rather than forced by a breakdown. The U.S. Department of Energy Federal Energy Management Program describes predictive maintenance as scheduling work based on the measured condition of equipment rather than on a fixed calendar or run-time interval.
What are the first steps to start a predictive maintenance program?
Start by defining a narrow problem and the assets in scope, then rank those assets by criticality so effort goes where failure hurts most. Next, match monitoring techniques to the failure modes that actually occur on those assets, set baselines and alarm limits, and choose inspection frequencies that fit each failure's warning time. Assign clear ownership for data collection and follow-up, then run a bounded first-wave pilot on a small set of critical assets before scaling. Building the path from detection to work order to verified repair from the start is what turns readings into results.
Which PdM techniques should a plant start with?
Start with the techniques that match the failure modes on your most critical assets. For plants dominated by rotating equipment such as pumps, fans, and motors, vibration analysis catches imbalance, misalignment, and bearing wear. Infrared thermography is a common early technique for electrical distribution and connections because it is fast and covers many assets per route. Oil analysis suits gearboxes, hydraulics, and large lubricated bearings. Ultrasound helps with compressed air leaks, steam traps, and early bearing and electrical faults. The right starting mix follows from your asset population and the failure modes present on it.
How many assets should a first-wave PdM pilot include?
Keep the first wave small enough to finish and learn from, usually a bounded set of high-criticality assets rather than the whole plant. A common approach is to pick one asset class or one production area where failures are frequent or costly, so results are visible quickly and the workflow can be tested end to end. Starting small lets a team prove the detection-to-repair loop, refine baselines and alarm limits, and build credibility before expanding coverage. The exact count depends on staffing, analyst time, and how many assets a single route can cover.
How do you set baselines and alarm limits for predictive maintenance?
Collect readings under normal, healthy operating conditions to establish a baseline signature for each monitored asset, then set alarm limits as deviations from that baseline. Published vibration guidance, such as the evaluation and classification criteria in ISO 20816-1, gives a starting point that must be tuned to the specific machine and its duty rather than a complete alarm-setting method. Baselines take time to stabilize, so early alarms may need review before they are trusted. Trending readings over time matters more than any single value, because a rising trend often signals a developing fault before an absolute limit is crossed.
What is the P-F interval and how does it affect PdM inspection frequency?
The P-F interval is the time between the point a developing fault first becomes detectable and the point of functional failure, a concept from reliability-centered maintenance practice. Inspection frequency has to fit inside that window, with margin left to schedule and complete the repair. A fault that develops over months can be caught with monthly or quarterly checks, while a fault that develops over days may need continuous or near-continuous monitoring. Choosing a frequency shorter than the P-F interval is what makes early detection possible.
How much does it cost to start a PdM program?
Costs vary widely with the techniques chosen, the number of assets, and whether monitoring is done on manual routes or with permanently installed sensors. Route-based methods using portable instruments have lower up-front cost, while continuous online monitoring adds sensor, wiring, and data-handling expense that has to be justified by the consequence of failure. Training and analyst competence are ongoing costs, and the ISO 18436 series exists because interpreting data reliably takes qualified people. The DOE Federal Energy Management Program O&M Best Practices Guide, prepared by Pacific Northwest National Laboratory, presents historical estimates of roughly 8 to 12 percent savings over preventive maintenance alone, drawn from past studies of the facilities those studies examined. Real savings depend heavily on the facility and asset mix.
How do you measure whether a PdM program is working?
Track whether findings turn into planned work and whether that work prevents failures, not just how many readings are taken. Useful measures include the number of developing faults caught and corrected before failure, the ratio of planned to unplanned work on covered assets, and avoided downtime or secondary damage from catches. Over time, reliability measures such as mean time between failures on covered assets can show whether the program is improving outcomes. Overall equipment effectiveness is an operations and performance measure that reflects availability, performance, and quality, and it adds useful context on how reliability gains show up in production. A program that collects data without closing the loop into scheduled repairs will not move these measures.
Related guides
Sources
U.S. Department of Energy, Federal Energy Management Program. Operations and Maintenance Best Practices Guide, Release 3.0. Chapters 5 and 6 cover maintenance program types and predictive technologies.
Pacific Northwest National Laboratory. O&M Best Practices: Maintenance Approaches. Prepared by Pacific Northwest National Laboratory for the DOE Federal Energy Management Program; presents the historical estimates of roughly 8 to 12 percent savings over preventive maintenance alone, drawn from past studies.
NASA. Reliability-Centered Maintenance Guide for Facilities and Collateral Equipment (2008). Covers condition monitoring and summarizes the age-reliability findings from Nowlan and Heap.
ISO 17359:2018, Condition monitoring and diagnostics of machines, General guidelines.
ISO 20816-1:2016, Mechanical vibration, Measurement and evaluation of machine vibration, Part 1: General guidelines.
ISO 18436 series, Condition monitoring and diagnostics of machines, Requirements for qualification and assessment of personnel.
F. Stanley Nowlan and Howard F. Heap, Reliability-Centered Maintenance, U.S. Department of Defense, 1978.