
As part of a larger research and development project involving multiple industries and distributed energy, we developed a unique tool called EMPOWER (Electric Motor Performance Optimization and Waveform Analysis and Recognition). This tool was initially designed for evaluating higher-order harmonics. We also utilize it for Current Signature Analysis (MCSA/CMCSA), based on rules we’ve developed over the past four decades.
Supra-harmonics are the missing link in unexplained bearing failures.
While we are primarily concerned with harmonic currents above those outlined in existing standards (50 orders per IEEE 519), the supra-harmonic range is defined as 2 kHz to 150 kHz. For our study, we have limited it to 22 kHz, with plans to expand to 150 kHz based on our findings.
Expanding the Focus: Supra Harmonics and Emerging Standards
The technology and supra-harmonic range have only been discussed over the past decade, with new standards having been written on how the data is collected (IEC 61000-4-30). Read more here: Harmonic Overload: Impacts Of High-Frequency Switching on Modern Electrical Systems.
The next step was to determine what to do with these high-frequency harmonics and investigate their impacts on electrical insulation, cabling, connections, electronic systems, and, of course, bearings. The driver has been the loss of bearings in unusual circumstances.
There has been limited research on the severity of high-frequency harmonics. In this article, we will discuss why decibel levels are used and how they can be used with a combination of power-side values and ground current values to determine the severity of various conditions.
Decibel-based analysis reveals the hidden impact of high-frequency harmonics.
We will utilize data from several machines tested at a site that was experiencing significant bearing failures, even with the use of shaft brushes. In this case, there are no input or output filters installed on the VFD systems, and the ground currents are high enough that, in certain areas, across-the-line electric motors and even some driven equipment are failing bearings due to fluting.
Figures 1 and 2 are the input and output current waveforms from the 75 HP VFD operating a 60 HP electric motor. The output frequency is ~60 Hz during testing, which reduces the high-frequency stresses; therefore, this can be considered the optimal operating condition for the machine.
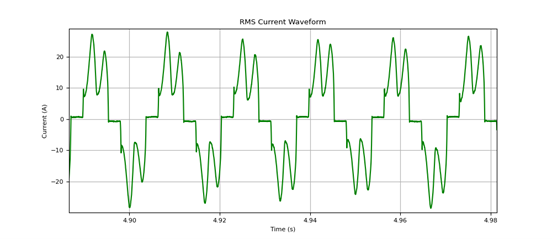
Figure 1. Input waveform for one of the VFDs locally.
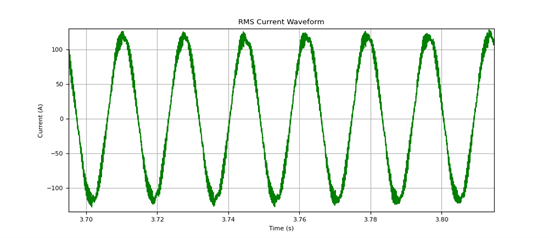
Figure 2: Output example from a drive to a motor.
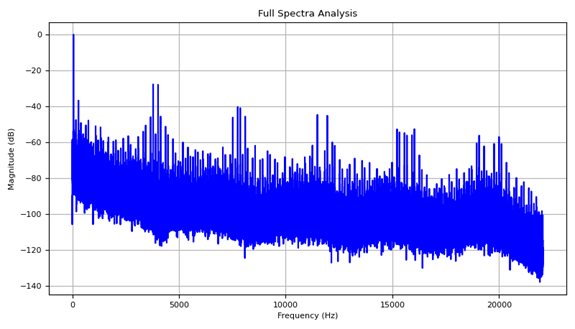
Figure 3: Output data spectral analysis and harmonics to 22 kHz.
We will return to the input impact of the current after discussing the findings in Figure 3. This is a result of electrical harmonics associated with the drive firing frequency. These high-frequency harmonics have an impact on shaft currents and insulation systems.
At higher frequencies, the brush resists current while the bearing invites it.
Additionally, the higher frequencies begin to increase the impedance of the shaft brushes while allowing high-frequency currents to pass easily through the bearings. In effect, the brush becomes more resistant while the bearing becomes less resistant due to a combination of skin effect and impedance.
How Supra Harmonics Shift Current Flow and Increase Risk
Bearing failures and filtering are a complex consideration. In this section, we will discuss the current flow related to brushes and higher-frequency currents, as well as the Relative Harm Index through higher-frequency decibel values. Both are associated with the impact of higher-frequency currents and the potential for damage in the short and long term.
High-Frequency Harmonics and the Breakdown of Shaft Grounding
High currents and higher-than-expected voltages in the ground system, as well as power system current harmonics, especially above 2 kHz, often result in higher currents passing through the bearing. This is the result of shaft brush impedance increasing with higher frequencies and the bearing impedance dropping, allowing a greater share of current to pass through the bearing instead of the brush. Most brush manufacturers focus on the brush but not on the associated circuit.
The frequencies of concern are not related to the 5th and 7th harmonics, although those can contribute, but are related to the harmonics of the firing frequency of the variable frequency drive.
This relates to the number of pulses present in the output voltage, the resulting noisiness of the current, the intra-harmonics (non-integer multiples of line frequency), which are also related to sidebands of the carrier frequency, and the type of shaft grounding system and/or bearing insulation used, if any. Table 1 is a reference to circulating current values and the potential damage to a bearing at the line frequency.
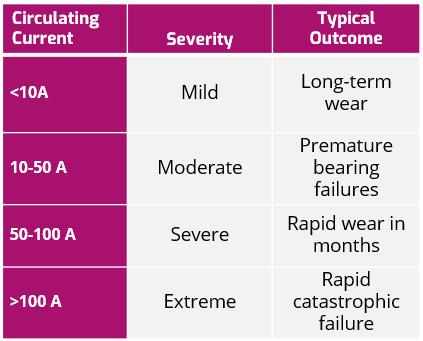
Table 1. Typical Current Severity (ref. ‘Bearing Damage and Failure Analysis,’ SKF, 2017.)
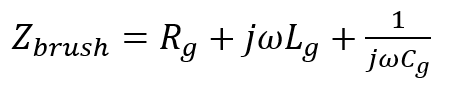
As noted, any level of current available across the bearing can generate long-term wear; however, consider that a current of less than 10 Amps at line frequency would not be as significant a concern. The frequency-based potential for damage would instead fall under the Relative Harm Index (RHI), which will be covered later. The share of current through the bearing will always exist as shown in Equation 1.
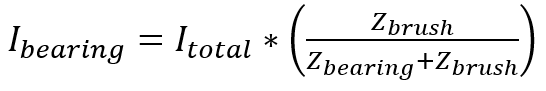
Equation 1
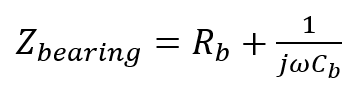
Equation 2
Equation 3
Where Rb is the leakage or film resistance, which depends on the lubricant film, metal contact, and contamination; Rg is the resistance of the grounding path; Cb is the capacitance across the bearing due to the oil fill between balls/rollers and races.
The oil film in the loaded portion of the bearing acts as a dielectric and has a high impedance from the operating frequency through somewhere under 2 kHz. As you approach 10 kHz, the impedance drops significantly in the bearing and remains either constant or increases in the brush; however, it definitely increases in the brush as you approach 20 kHz.
This means that the currents will shift from the brush to the bearing, with the expectation that the current will be low, unless potential damage from higher frequencies is taken into account. The result is an increase in currents associated with the higher frequencies passing through the bearing compared to the brush.
Even small currents at high frequencies carry exponentially greater risk.
The higher-frequency currents, referred to as supra-harmonics, ranging from 2 kHz to 22 kHz in this study, will be evaluated in decibels for the RHI. Intra-harmonics have an even more significant potential harm, but we will not address that extremity other than identifying the increased harm.
Quantifying Damage: The Role of the Relative Harm Index (RHI)
One of the study’s objectives was to determine if harmonic-related currents from the variable frequency drive for each tower were present. Higher-frequency data, ranging from 2 kHz to 22 kHz in current, is typically expressed in decibels (dB) relative to the primary frequency. VFD-related harmonics include both the carrier (firing) frequency of the IGBTs as well as sidebands, which make up inter-harmonics (non-integer harmonics).
One of the challenges being addressed is related to potential conductor and brush issues associated with supra-harmonics. Supra-harmonics are defined as voltage or current harmonics that range from 2 kHz to 150 kHz. The indicators within the findings suggest that the harmonics are expected to extend beyond the 22 kHz range of the EMPOWER MCSA system used for this project. The dB values provide a relationship between potential harm and the effects on components within the system.
The evaluation of the potential condition as harmonics increase involves ‘relative energy’ and is extended to ‘relative harm.’ The dB values are determined as shown in Equation 4 and represent the logarithmic scale related to spectral frequencies in relation to the primary frequency, where If is the frequency of interest, and the Ipeak relates to the peak current at line frequency.
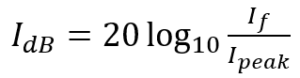
Equation 4
Relative energy identifies the energy content of a harmonic component as it is related to the fundamental and is related to the square of the current amplitude, as shown in Equation 5.
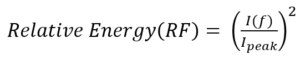
Equation 5
The relative energy helps determine the amount of stress, heating, and vibration potential associated with each harmonic component. Figure 4 represents the values at the fundamental and the relative energy at that value.
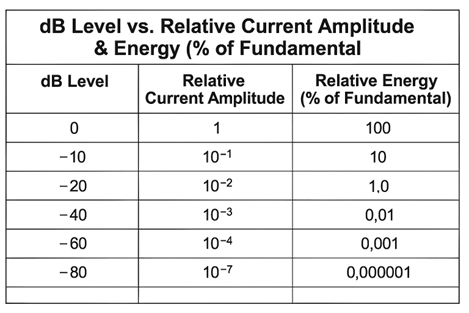
Figure 4. dB level vs Relative Current Amplitude and Energy at the fundamental frequency.
When applied to frequencies above the fundamental, a Relative Harm Index can be generated in which the relationship of the -dB values related to the fundamental (assuming 60 Hz) can be determined. The RHI can be determined by Equation 6, where the RHI is normalized to one at 60 Hz and 0 dB.
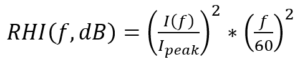
Equation 6
Using the RHI, we can then review Tables 2 and 3, which identify frequency ranges and relative harm, as well as the impact on the condition of equipment and potential issues. These can then be compared to a heatmap (Figure 5) of dB (X-axis) versus frequency (Y-axis), which is a diagnostic visualization tool used to evaluate how current harmonics at different frequencies and amplitudes impact potential damage to components.
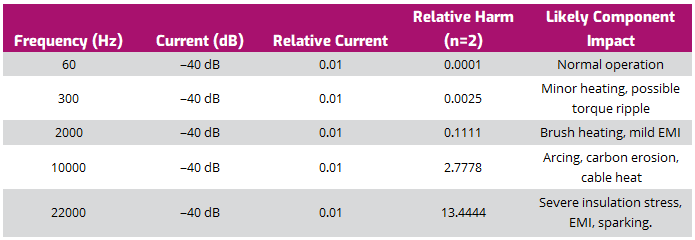
Table 2. Relative Harm at -40 dB (note that a harmonic 10X the frequency at the same amplitude causes 100X the harm).
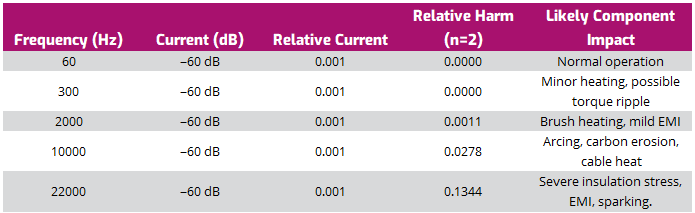
Table 3. Relative Harm at -60 dB
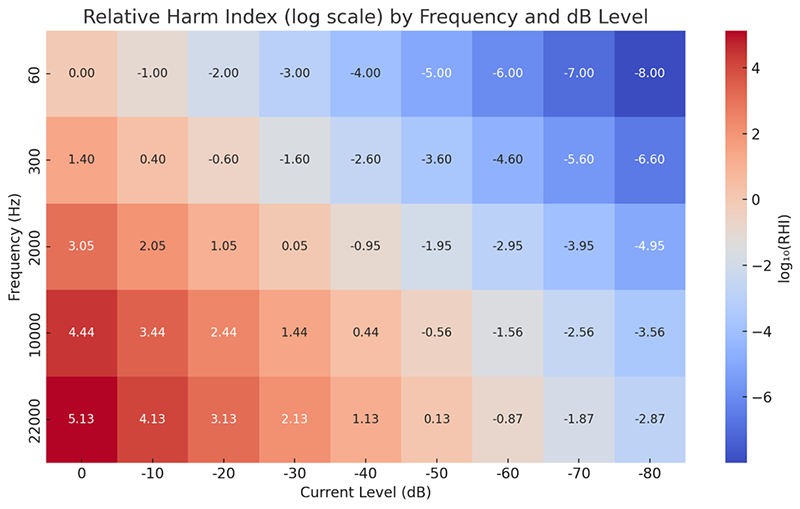
Figure 5. Relative Harm Index by dB level
In Figure 5:
- 0 on the scale = RHI of 1 (same harm as fundamental current at 60Hz)
- 1 = 10X the harm
- 2 = 100X the harm
- -2 = 1/100th the harm
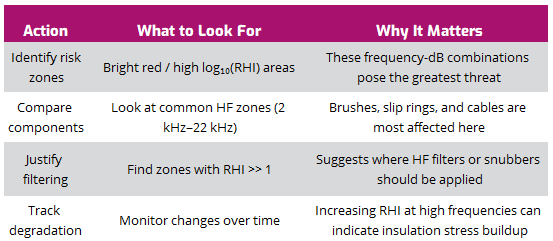
Table 4. How to Use the RHI Heatmap
Power Data Example
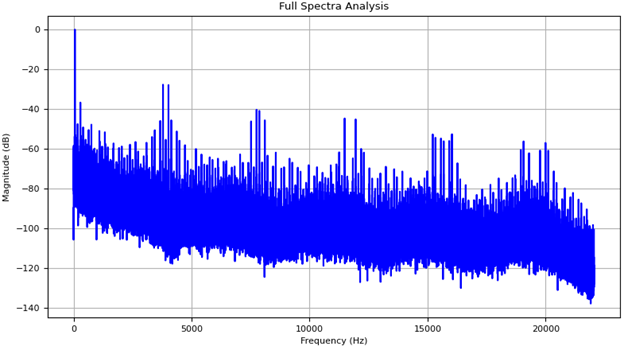
Figure 6. Fan-inverter-driven machine at line frequency.
As noted in Figure 6, the machine is at -40 dB at ~7.5 kHz, -43 dB at ~12.5 kHz, -75 dB at ~16 kHz, and -60 dB at ~19 kHz. This would be considered in the yellow, where you would want to install an output filter from the drive. While not posing an immediate danger, the machine’s life would be considered degraded, with a potential bearing current issue resulting.
Ground Data Example
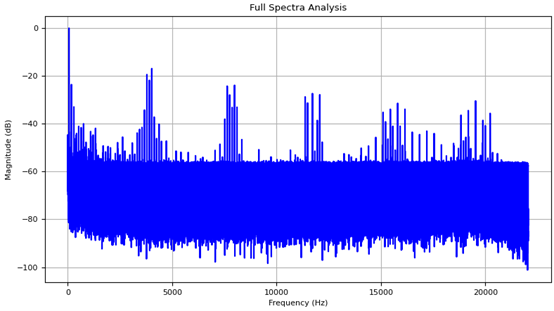
Figure 7. Fan ground current harmonics
In Figure 7, the scale is very different. With the frequencies and relative currents on the ground, a majority of the higher-frequency ground current flows through the bearings (yes, both).
This provides an RHI of greater than 2 at ~20 kHz, indicating that the conditions will ultimately result in a bearing current failure, given that the relative current values are less than 10 Amps. Filtering the power side should resolve this issue unless the high-frequency currents have degraded the winding.
Finally, we will return to the input power harmonic conditions. Figure 8 shows the impact of the waveform from Figure 1.
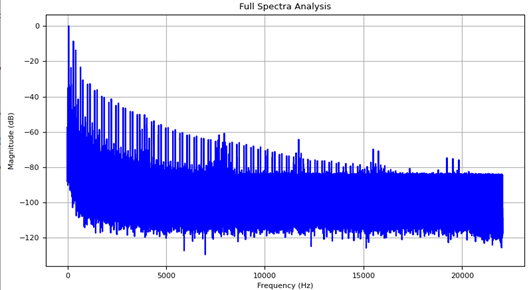
Figure 8. Harmonics to 22 kHz from the waveform in Figure 1.
The conditions in Figure 8 require examining the spectrum in the red range, with 300 Hz at -8 dB, indicating that damage will occur in systems on the supply side of the VFD without filtering.