

Today, maintenance and engineering managers try to do more with less but are still expected to meet their organizations’ goals, objectives, and expectations. How do managers achieve more with less? The answer is to build a compelling business case for planned purchases and projects.
A solid business case turns maintenance from a cost into a value driver.
If done properly, this process can help managers create a path from the worst of times to the best of times.
When I was a plant manager, my maintenance manager told me we needed to hire two technicians. I denied his request. Why? Because he came to me with an emotional request. As leaders of organizations, managers cannot make business decisions based on emotion. They must make critical decisions based on the validity of a business case and the return on investment (ROI).
I want to focus on two areas. The first is the business case and ROI for human resources. The second is the business case and ROI for tangible and nontangible assets.
Making the ROI Case for Maintenance Headcount
Let’s start with the business case for adding headcount. This move only makes sense if it increases the organization’s value and offsets the additional financial burden. The average maintenance technician spends 18 percent of the workday looking for parts and tools and 24-25 percent walking to and from the job site.

All this non-value activity results in the average technician’s 17-24 percent utilization. How can managers improve that utilization number and make a business case to show the ROI?
Utilization isn’t a headcount problem—it’s a planning problem.
One important reason for this low productivity is the lack of maintenance planning and scheduling. Managers have options in this scenario. One is to promote from within.
The argument for promoting from within and moving a seasoned technician to the planner role is that the move takes a skilled person off the tools. While it is a valid point, history shows that the utilization improvement of the other technicians far outweighs the loss.
Boosting Utilization Through Better Planning
Instead of each technician planning their work, have one of the best workers develop quality job plans so the other technicians can accomplish their tasks to the same level of quality. Creating a combined weekly schedule of preventive and corrective activities keeps the staff engaged and improves utilization.
For example, a manager has a staff of 20 technicians with an average hourly rate of $50 fully burdened and a utilization rate of 25 percent. The staff averages 800 hours of maintenance activity a week. If they operate at 25 percent utilization, they work only 200 of the required 800 hours.
Studies have shown that using a planner to develop quality job plans and an executable schedule can increase utilization by about 50 percent.
Promoting one of the 20 technicians to the planner’s role is expected to improve utilization from 25 percent to 37.5 percent. It will also add 100 hours to the workweek, or 5,200 hours over the year, thereby improving utilization by $260,000.
That is the business case. The ROI is the utilization improvement. Also, the department did not hire anyone, avoiding payroll increases.
The move still leaves the department short of the required 800 hours, but the manager can consider other strategies to improve, such as optimizing preventive maintenance (PM), kitting and staging materials, implementing reliability-centered maintenance, conducting failure modes and effects analysis, and using technology to improve the equipment.
Making the Case for Tangible and Intangible Investments
An asset is any item or entity that has potential or actual value to an organization and technology. Understanding where organizations’ dollars are being spent is critical.
For example, ultrasound, thermography, vibration analysis, and motor circuit analysis technologies are all tangible assets. Computerized maintenance management systems (CMMS), HVAC fault detection and diagnostics (FDD), and process and utilization improvements are considered intangible assets. Managers struggle with identifying, calculating, and expressing cost avoidance and reductions to top management.
Making Smart Technology Investments Count
Let’s start with tangible assets. Managers should consider total returns and costs to calculate ROI with the highest degree of accuracy. For an apples-to-apples comparison between competing investments, managers should consider annualized ROI.
When calculating costs, make sure to calculate life-cycle costs, which include all costs associated with design, procurement, storage, installation, start-up, operation, maintenance, decommissioning, and removal.
Lifecycle cost—not purchase price—is the real number that matters.
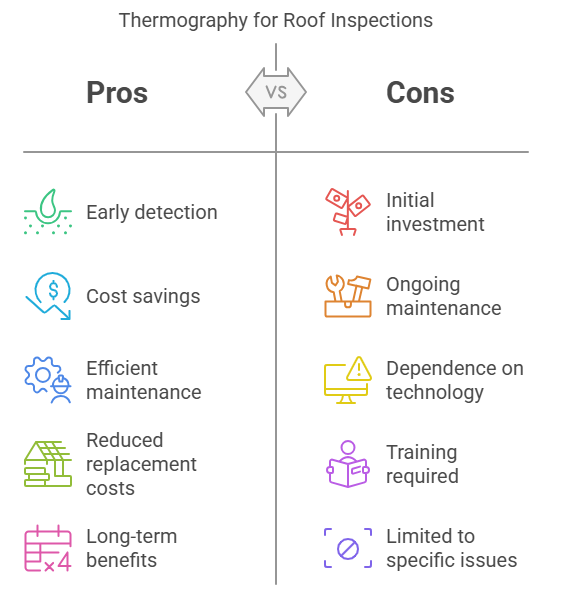
Thermography in Action: A Real-World ROI Example
Consider thermography technology. Since heat is often an early symptom of equipment damage or malfunction, monitoring asset temperature levels should be a primary part of any PM program. Infrared technology simplifies the task of quickly spotting unusual conditions that require further evaluation.
Technicians can use thermography to identify hot spots in electronic equipment, locate overloaded circuit breakers in power panels, and identify roof leaks.
For example, a manager convinced top management to buy two 500 MHz four-channel infrared (IR) scope meters for $15,000. The organization operates a facility with a 360,000-square-foot roof area. The roof is over 22 years old and experiencing several leaks. Cost estimates for replacing the roof were up to $3 million.
An initial IR inspection identified a 1,208-square-foot roof requiring replacement at a cost of $20,705. The following year, another IR inspection found that the roof needed to be replaced for 1,399 square feet at a cost of $18,217.
The department started a roof IR inspection program and surveyed the roof each year. The survey identified less than 200 square feet of roof needing replacement in any one of the following four years. As a result, the total cost for roof repair and upkeep for the six years was less than $60,000.
If the facility had been privately owned, interest on the initial $3 million roof replacement cost at 5 percent would have been $150,000 for the first year alone.
Discounting interest on $3 million over the five-year period, simple cost avoidance resulting from IR survey and repair versus initial replacement cost—$3 million to $60,000—amounts to $2,940,000. This figure does not consider interest on the $3 million, which would result in cost avoidance of $500,000-800,000, depending on loan interest paid.
Beyond Equipment: Calculating ROI on Software and Systems
Intangible returns can also prove advantageous. Whether a manager is thinking about installing new applications or wants to purchase or upgrade a CMMS, calculating the ROI can help make a more informed decision that can provide immediate and long-term benefits.
Investing in technology can increase employee productivity and utilization, automate processes, and minimize early equipment failures. But without proper training and understanding, technology will only speed up technicians’ mistakes. Again, managers need to build the business case, including the ROI.
Technology without training just accelerates mistakes.
Managers need to consider a range of issues when adding technology to the organization, including acquisition costs and implementation, the application’s impact on the facility, training costs, re-engineering processes, short—and long-term goals and objectives, and the impact on the organization’s culture.
Managers can use two popular ROI calculations. The first is net present value, which is a project’s return at a specified discount rate. Ideally, this return should be high or positive. The second is the internal rate of return, which is the yearly return percentage of the investment.
Consider the example of a large campus spending excessively on energy heating and cooling costs. The manager made a business case to invest in HVAC FDD. As a first step, faults were identified within several large air-handling units. A fault can degrade the system’s efficiency by roughly 20 percent, causing the unit to run longer to meet space cooling load demands.
The manager based the current monthly average costs on a comparison of before and after the implementation of FDD. The initial monthly estimate for cost reductions was around $18,000. After the installation of the HVAC FDD system, it was discovered that there was an imbalance in the airflow.
By correcting the circulation pump operation in an air-handler heat recovery loop, the actual cost avoidance was an average of $20,160 per month, a 12 percent reduction. That was an annual cost avoidance of $241,920. The industry average in energy cost reductions was 8-15 percent. Initial HVAC FDD systems range from $500-$1,000 per unit.
Whatever a manager calculates as the financial return, reduction, or avoidance, they must have someone in finance review the calculations to validate the numbers because the first department of top management will ask to confirm the numbers in finance. If finance says they already ran the numbers and agreed, the manager might have won the battle and the war.
Managers who use wisdom and understanding to identify facility improvements for tangible or intangible assets, build a business case, and demonstrate the financial ROI to top management can make these the best of times.