
Return on Net Assets (RONA) is commonly referred to as a measure of management effectiveness. From an accounting perspective, RONA is the income statement divided by the balance sheet.
When one looks up details about a publicly traded stock, one will usually find Return on Assets (ROA) and Return on Equity (ROE) under the heading “Management Effectiveness.” RONA is very similar to ROA. The primary difference is that ROA is based on the book value of the company’s assets, while RONA is based on an estimate of the current market value of the assets.
RONA isn’t just an accounting metric—it’s a direct reflection of how well assets are managed to generate profits.
RONA and the closely associated KPI of Return on Capital Employed (ROCE) drive value for company owners. In fact, RONA is a very important component of company valuation and a major driver of demand and price for publicly traded stocks. Let’s explore this important KPI from the perspective of physical asset management.
Understanding Return on Net Assets (RONA)
The owners of publicly traded or privately held companies in the manufacturing, process, mining, and other asset-intensive industries invest money to build plants and buy, among other items, equipment, supplies, and services for manufacturing, processing, or extracting things of value. They expect to make a profit on their investments.
The Formula Behind RONA: Breaking It Down
That profit is generally defined as RONA. It’s calculated by dividing the firm’s earnings before interest, tax, depreciation, and amortization (EBITDA) by the replacement asset value (RAV) of the plant and its equipment plus inventory on hand, which represents the Net Asset.
RAV is used in lieu of book value to achieve temporal equivalence. For example, evaluating 2025 profits relative to an investment made in 2004 would be inaccurate.
Challenges in Calculating RONA and How to Overcome Them
On the surface, RONA is a relatively simple metric to calculate, which is part of its appeal. The most challenging part is determining the RAV for the plant and inventories. It can be difficult to estimate these values in present values.
The biggest challenge in calculating RONA isn’t the math—it’s accurately valuing your assets.
Some organizations utilize the insure value as an estimate for RAV. Some use the purchase value plus some compounding rate to reflect inflation. For example, a plant that cost $10 million to build 20 years ago would be worth $14.85 million in today’s dollars, assuming a 2% inflation rate.
The combined total of RAV and inventory on hand is called the Net Operating Asset in Place (NOAP). Real property is typically excluded from the RAV and RONA calculation.
How Reliability and Asset Management Professionals Influence RONA
In a nutshell, reliability and asset management professionals are responsible for delivering operational reliability, uptime, and low operational costs.
OEE and RONA: The Critical Connection
Each additional percentage point of OEE gained is more profitable than the previous one. The reason is simple: A plant requires a certain number of OEE percentage points to cover the fixed operation costs.
Table I illustrates this point. In this graphic, I’ve created an imaginary company presented under three asset management scenarios: 1) the lower-quartile asset manager, 2) the average asset manager, and 3) the upper-quartile asset manager.
High OEE doesn’t just improve efficiency—it directly drives higher RONA and profitability.
As Table I shows, the lower-quartile performer in my example achieves an operational availability of 80% and a yield/speed of 75%. I’ve assumed 100% quality, which results in an OEE of 60%. I’ve assumed that the lower-quartile performer achieves $1 billion in sales. By contrast, the average asset manager, in my example, achieves an availability of 85% and a yield of 80% for an OEE of 68%.

Table I. RONA comparison under three different levels of asset-management effectiveness.
These extra eight percentage points of OEE push the average asset manager’s sales to just over $1.13 billion. The upper-quartile asset manager, in my example, achieves sales of $1.275 billion based upon availability of 90%, yield/speed of 85%, and an OEE of just over 77%.
In all the above scenarios (low, average, and high), sales equal about $16.7 million per OEE point. However, the profit picture is very different. The lower-quartile asset manager achieves a profit of $65 million, or about $1.08 million per OEE point. In contrast, the upper-quartile performer that leverages the NOAP more effectively achieves profits of $1.42 million per OEE point.
That’s because, despite the proportionally higher cost of goods sold (COGS) and asset management costs (which are set to 23.5% of sales), the fixed cost of $100 million is distributed across a much greater number of production units sold for the upper-quartile scenario.
As a result, the lower-quartile performer delivers an anemic 5.7% RONA compared to 7.6% RONA for the average case and 9.6% RONA for the upper-quartile performer.
Beyond OEE: Other Ways to Improve RONA
In addition to driving profits and RONA performance through improved OEE, upper-quartile managers generally have lower operating costs and often have leaner asset bases and inventory levels, which further improves profitability and RONA. As a reliability engineer, I can say that, mathematically, the fast way to improve operational reliability is to have two assets when you only need one.
A bloated asset base erodes RONA. Leaner operations deliver stronger financial performance.
If, for example, a process pump has a calculated operational reliability of 90%, and the operator installs a standby, the duty-standby combination achieves a calculated reliability of 99%. If you have three pumps but only need one, the reliability jumps to 99.9%. The math really is simple. The problem is that the NOAP for the plant grows, which also causes maintenance costs to increase.
This concept is extended to inventory, too. It’s generally accepted that Maintenance, Repair, and Operations (MRO) inventory has a carrying cost of 22% of the value per year due to the cost of capital, shelf-degradation, obsolescence, pilferage, space, systems, people for management, and the like.
Lean operators use just-in-time (JIT) inventory practices, whereby materials arrive just as they’re required to minimize time on hand. JIT demands reliability. Unfortunately, if a plant and its assets are unreliable, MRO stores tend to expand with plenty of “just-in-case” inventory.
What’s worse, that type of “We need parts and material on hand just in case something fails” scenario basically means “We are planning to fail.”
Data-Driven Asset Management: What the Numbers Say About RONA
In a 2009 study, The Aberdeen Group (now Aberdeen, aberdeen.com) found that lower-quartile asset managers spent more on maintenance and sustaining capital than their upper-quartile counterparts. Their research also found that lower-quartile performers spent 23.5% of sales on asset management as opposed to 17.2% for upper-quartile performers.
World-class asset management isn’t just about cutting costs—it’s about maximizing returns on every dollar invested.
When we plug in those asset-care costs, a slight reduction in the RAV of the plant due to reduced dependency on standby systems, and a somewhat leaner MRO-inventory value, we can begin to see the full value of world-class equipment-asset management that’s shown in Table II.
The upper-quartile performer’s profit is nearly triple that of the lower-quartile performer. And, with a leaner balance sheet due to a lower NOAP, the upper-quartile performer achieves more than three times the RONA value with 18.3% vs. 5.7% for the lower-quartile performer.
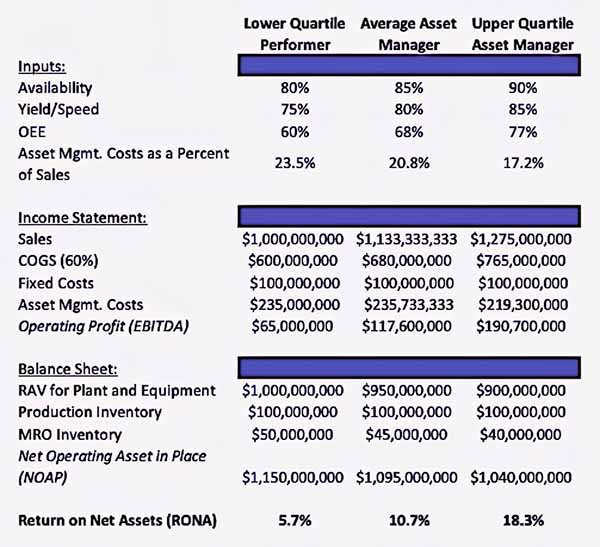
Table II. The combined effect of increasing OEE, reducing asset cost, and leaning the NOAP.
The Bottom Line: Why High RONA Matters for Business Success
In this article, we’ve introduced Return on Net Assets (RONA), a high-level measure of management effectiveness. In the simplest of terms, RONA is a company’s income statement divided by its balance sheet. It’s a major driver of a company’s valuation.
Reliability and asset management professionals have a significant impact on RONA. As I’ve explained, we can profoundly impact RONA performance by pushing overall equipment effectiveness OEE up, proactively driving asset-management costs down, and reducing redundancy and maintenance, repair, and operations (MRO) spares.