
Is anyone else like me? There’s not a day that I don’t measure something. I’m a triathlete, so I measure an unusual amount of stuff. How many miles do I run, bike, or swim? I track my 401k, gas mileage, and even my budget.
I do these things because I want to improve in some way. I don’t think we can ever escape measuring, tracking, or following things.
What we track in life mirrors what we must track at work.
As goes our personal lives, so goes our work. “You can’t manage what you don’t measure,” said Peter Drucker.
Whatever you call it — metrics, measurements, or key performance indicators (KPI) — maintenance and engineering managers must have performance measurements in place to validate the work their staff is performing to achieve the department’s goals and objectives or identify opportunities for continuous improvement.
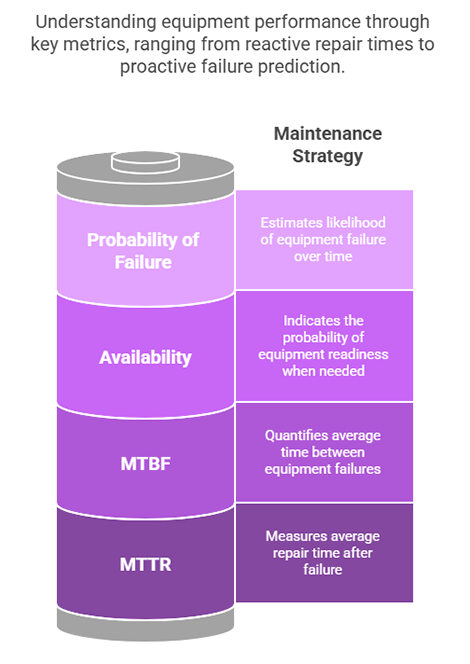
Among the most commonly used measurements that managers can put into practice to determine performance are:
- mean time to repair (MTTR)
- mean time between failure (MTBF)
- availability
These measurements enable managers to track equipment, personnel, and reliability performance. At the end of the day, each of these measurements financially impacts the organization.
The Metrics Behind Smarter Maintenance Decisions
For managers, measuring and monitoring their departments’ activities is essential in determining how they affect the facility’s overall condition and performance. Below are examples of tracking and measuring that can produce tangible results for both departments and facilities.
MTTR
Sometimes referred to as maintainability, MTTR is the measure of the department’s ability to perform maintenance to retain or restore assets to a specified condition. It measures the average time required to restore an asset to its full operational condition after a failure. This measurement typically is expressed in hours. The equation is straightforward: the total repair time divided by the number of repairs or replacement events.
For example, a facility is responsible for maintaining a standard air-handling unit (AHU) that has operated for 3,600 hours over the past two years. The AHU’s blower unit has failed 12 times over this period. The chart on this page shows the following times to repair. Taking the total time to repair the unit and dividing that number by the number of failures produces an average time to repair the unit of 60 minutes. So the MTTR is one hour.
MTBF
MTBF is a basic measure of an asset’s reliability. It is calculated by dividing the total operating time of the asset by the number of failures over a given period of time. Taking the example of the AHU above, the calculation to determine MTBF is: 3,600 hours divided by 12 failures. The result is 300 operating hours.
Availability
This measurement expresses the probability that an asset can perform its intended function satisfactorily when needed in a stated environment. The availability of an asset will diminish over time as the equipment is being used. The availability will not improve unless changes are made to upgrade the asset.
Technicians can extend the equipment’s availability by increasing its reliability. There is a generally accepted availability standard of 95 percent for equipment, but mission-critical equipment in facilities requires a much higher level of availability.
To calculate availability, use the formula of MTBF divided by (MTBF + MTTR). Continuing with the above example of the AHU, its availability is 300 divided by 360. The result is 83.3 percent availability
Probability of Failure
At times, managers need to calculate the probability that a piece of equipment will fail within a certain time frame. This is commonly done using the exponential distribution, which models the time between failures for systems with a constant failure rate.
The formula for reliability (the probability that the system does not fail during time t) is:
R(t) = e^(-λt)
Where:
- R(t) is the probability of survival up to time t
- λ is the failure rate, calculated as 1 divided by the Mean Time Between Failures (MTBF)
- t is the time duration of interest
- e is Euler’s number (approximately 2.718)
Example:
Suppose a manager wants to ensure the availability of an Air Handling Unit (AHU) for the next 72 hours. The AHU has an MTBF of 300 hours. First, calculate the failure rate:
λ = 1 / 300 = 0.00333
Now calculate reliability over 72 hours:
R(72) = e^(-0.00333 × 72) = e^(-0.24) ≈ 0.7866
This means the probability that the AHU will not fail during the next 72 hours is 78.66%, and the probability that it will fail is:
P(failure) = 1 – R(72) = 21.34%
From Metrics to Maintenance Strategy
What does all this math add up to? If managers do it properly, the calculations can determine when a piece of equipment might fail or the probability of when it will fail. With this information, managers can develop strategies to manage risk, improve preventive maintenance processes, introduce predictive maintenance technologies, and ultimately reduce costs.
Managers who opt not to measure, track, and respond to the results are putting their organizations at risk. It has been reported that reactive maintenance can be three-four times more expensive than proactive maintenance and that 30-33 percent of a department’s average maintenance budget is wasted on poor maintenance practices.
Reactive maintenance can cost 3–4x more than proactive strategies.
By measuring failure rates and probability of failure, the potential could pay big dividends by refocusing our efforts to eliminate failure, unscheduled downtime, and risk. Now, if I could only use this data to help me bike faster!
If equipment availability is lower than 95 percent, that could be a valid reason for a manager to conduct a formal root-cause analysis or a failure-modes-and-effects analysis. Finally, in facilities with mission-critical equipment that must maintain a high level of availability and where the probability of failure is high, managers must take action to remedy the risk, such as redesigning or upgrading the component or the system.
Building a Reliability Culture Takes Time
When attempting to implement a reliability culture within a maintenance and engineering department, it actually will take managers some time to acclimate department staff and front-line technicians to a new way of performing and thinking. It is considered common that when embarking on the reliability path, maintenance costs actually increase initially.
Reliability cultures cost more at first—but deliver big wins long term.
In Ron Moore’s book Making Common Sense Common Practice, he cites two studies.
The first study, Ormandy’s “Achieving the Optimum Maintenance and Asset Strategy and Ensuring They Are Aligned with Business Goals,” found that maintenance costs increased by 15 percent in departments, making the transition to a reliability culture, but over time, were reduced by 20 percent.
The second study, by C.D. Kelly, entitled “Leadership for Change: Developing a Reliability Improvement Strategy,” found the following results.
- Repair expenses increased by 30 percent during the first 12-18 months, then declined to 50-80 percent below the original levels after 24 months.
- Breakdowns declined by 50-60 percent.
- Downtime declined by 60-80 percent.
- The spare parts inventory decreased by 20-30 percent.
By measuring failure rates and probability of failure, the potential could be major dividends that help managers refocus their efforts to eliminate failure, unscheduled downtime, and risk. Now, if I could only use this data to help me bike faster.