
The Role of RCA in Diagnosing Mechanical Breakdowns
When performing a Root Cause Analysis (RCA), there is a data collection step called ‘Preserve,’ which requires the team to collect failed parts, conduct interviews, and obtain paper data and positional information after an undesirable event occurs.
The method also has a step to construct a logic tree and hypothesize all of the possible ways an undesirable failure mode can occur. This paper explores what internal knowledge is helpful when examining failed parts and how that knowledge verifies the physical possibilities on the logic tree.
When leading an RCA investigation, the investigator collects failed parts like bearings, mechanical seals, shafts, etc.
Every broken part has a story—your job is to listen.
The broken parts are inspected to determine what forces the part experienced as the event unfolded. Knowing the forces present allows the RCA team to verify whether a certain hypothesis did or did not occur.
There are two types of mechanisms that cause mechanical failures. There is either a loss of material or the material is overpowered. There are additionally two mechanisms that cause material loss: 1) material can have loss because of corrosion, or 2) there is material loss from erosion/wear.
Two mechanisms overpower materials: 1) the material is overpowered with a single load application, or 2) the material is overpowered over time by fatigue.
The Four Core Causes of Mechanical Failures
There are four all-inclusive buckets or hypotheses used in logic trees that cause material failure:
- Erosion
- Corrosion
- Fatigue
- Overload
How Mechanical Components Fail Under Stress
For now, we will discuss the mechanisms that overpower materials. Since 90% of all mechanical failures are caused by fatigue, we will discuss fatigue first.
Fatigue vs. Overload: Understanding How Components Break
Fatigue occurs when a material is subjected to repeat loading and unloading. When the loads are above a certain threshold, microscopic cracks begin to form at the surface of stressed areas, and a crack(s) will occur. Eventually, a crack will reach a critical size. This will be when the remaining material can no longer support the load, and the material will suddenly fracture.
Overload failures occur in two forms based on whether the material is brittle or ductile. If the material is brittle, it is called a brittle overload fracture. Brittle overload occurs instantly, usually from a single load application. If the material is ductile, it will become deformed and fail plastically.
A fracture’s surface tells you everything—if you know how to read it.
When analyzing the failure type, an easy way to identify fatigue failure is there has to be an origin(s) plus one. If the failed part has an origin plus progression marks, it is fatigue. If the part has an origin plus a final fracture zone, it is also fatigue.
Sometimes, the load variations are so minor you can’t see the progression marks visually, but there is a final fracture zone. These are the most frequent. We won’t get into other indicators right now as they add unnecessary complexity.
Identifying Brittle and Ductile Failures Through Visual Clues
A ‘salt and pepper’ look on the surface can determine Brittle overload failures. The salt and pepper appearance is due to the fracture moving across the surface so fast. The origin can be determined by following chevron marks (they look like arrows) and pointing to the origin.
The chevron marks will only be present in brittle overload failures. If the fracture was a tension failure, you will likely have a hinged lip. We see this with fastener failures and sometimes alignment pin failures. The final visual is the failed pieces look as if they can be put back together perfectly. Don’t worry, pictures are coming!
Ductile overload failures are visually determined by material deformation. Ductile failures happen in the plastic range of the stress-strain curve, so they will have a ‘cup and cone‘ appearance when they fail in tension.
The surface may also be fibrous. We often see this in wire rope failures because wire rope is ductile, and the job it performs is lifting. Therefore, it tends to fail most often in tension.
Now, let’s show how this would work when performing an RCA.
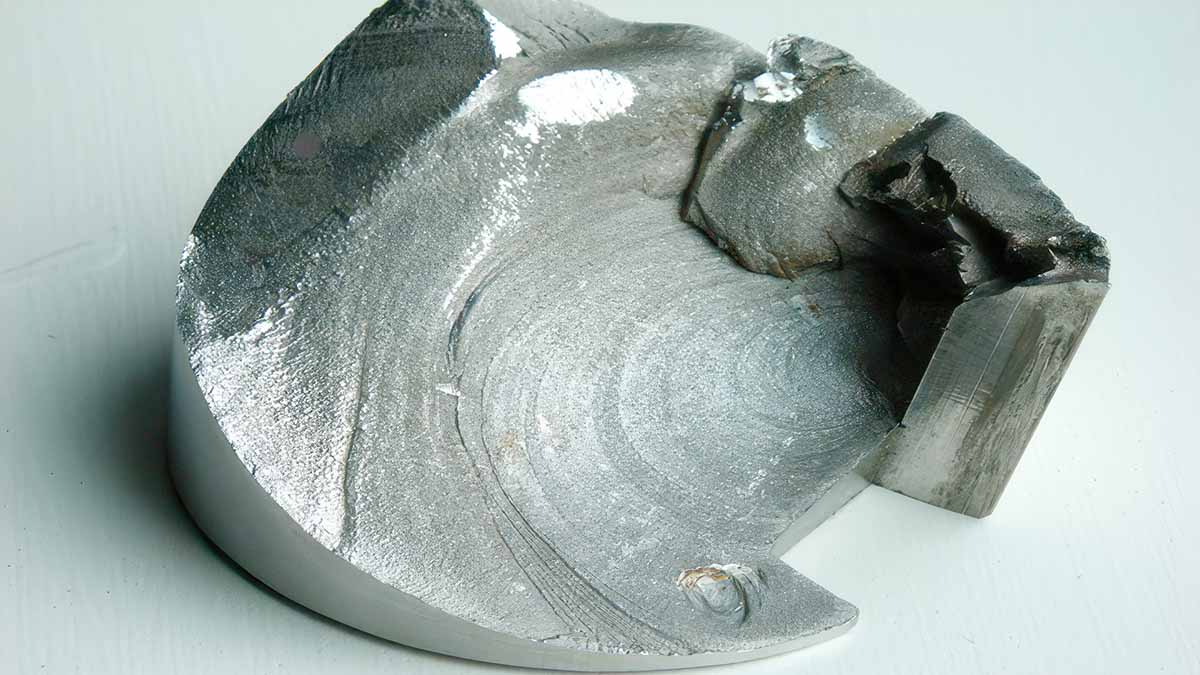
For example, let’s say you experienced an unexpected pump shaft failure on PCH-112. You have collected the failed shaft, which looks like the shaft below (Figure 1).

Figure 1: Unexpected Pump Shaft Failure
The logic tree being developed by the RCA team states that the Event was ‘PCH-112 Unexpectedly Lost Function’ and that the only Failure Mode is ‘Shaft Failed.’ The first level of hypotheses answers the question, ‘How can a shaft fail?’
As stated earlier, there are four all-inclusive buckets (as stated earlier) for how a shaft can fail; the shaft can erode, corrode, fatigue, and/or overload.
At this point, the logic tree would look similar to the one below (Figure 2). To determine which possibilities did and did not occur, we will use the failed shaft inspection results to help us.
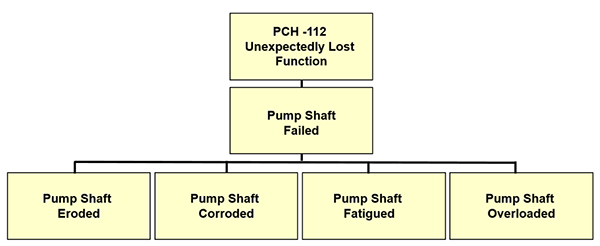
Figure 2: Top Levels of Logic Tree
How Logic Trees Streamline Failure Investigations
When interpreting a logic tree, remember that the top box is the Event or Undesirable Outcome that forced us to act (PCH-112 Unexpectedly Log Function). This happened because the Pump Shaft Failed (Failure Mode). We know these to be true because we can see the evidence with our eyes.
Logic trees turn failure analysis from guesswork into science.
Level to level in a logic tree is essentially a cause-and-effect relationship. Underneath the Mode level, as we explore the physics of the failure, we simply keep asking ‘How Could?’ This will generate hypotheses that must be proven or disproven with hard evidence (not hearsay). Figure 2 shows how we expressed our four hypotheses for how our shaft could have failed.
If an analyst doesn’t know fracture basics, they would most likely have to send the broken part to an internal or external expert (metallurgist) for analysis. They would then have to wait for the report explaining the forces present at the time of failure.
Analysts with basic metallurgical knowledge can identify those forces themselves (with their trained eye) and move the RCA forward. Let’s examine what this part is telling us.
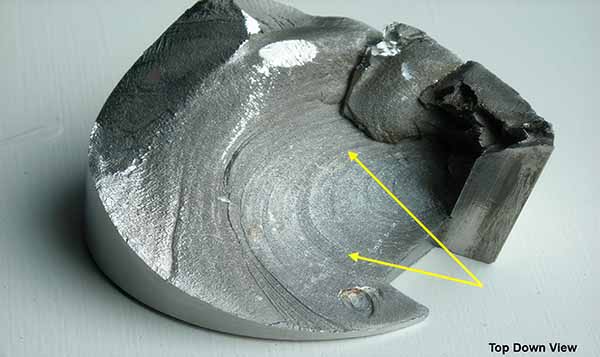
Figure 3: Progression Marks
The arrows in the photograph above point to progression marks (Figure 3). There are many progression marks across the surface of the fracture. Progression marks are only present in fatigue failures. They represent the propagation of a crack.
Cracks need load fluctuations to propagate across the shaft surface. The more rapid the growth, the farther apart the progression marks will be. The information at this point has verified the failure as fatigue. What other information is present in the part?
In the photograph below (Figure 4), we can see the crack origin. When we follow the progression marks backward, it points out the crack origin, which is always the point of the highest stress. This is usually a sharp corner; in this case, it is the sharp corner of the keyway.
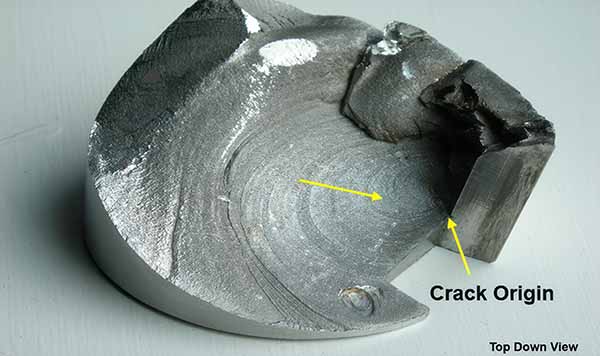
Figure 4: Crack Origin
When the progression marks are followed away from the origin, we will find the Final Fracture Zone (FFZ). The FFZ is where the material can no longer support the remaining load and breaks. The FFZ also has information for the investigator.
The larger the FFZ, the heavier the load was at the time of failure. This part’s FFZ was small. Therefore, the load was minimal. Here, a fatigue failure started in a sharp corner of the keyway under minimal load (Figure 5).
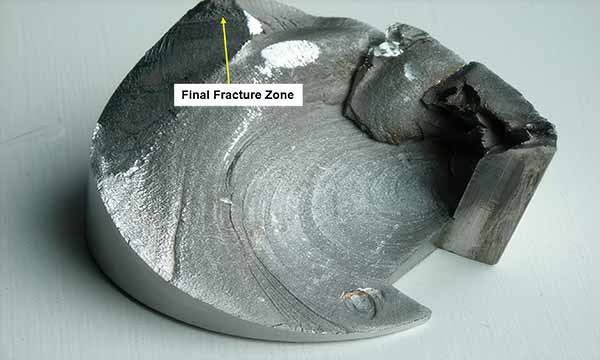
Figure 5: Fatigue that started in Sharp Corner of Keyway
The shaft’s side view below also contributes some information. Figure 6 shows the part turned up on its side; the break is at about a 45-degree angle. This indicates that some torsion and/or bending also occurred at the time of failure.
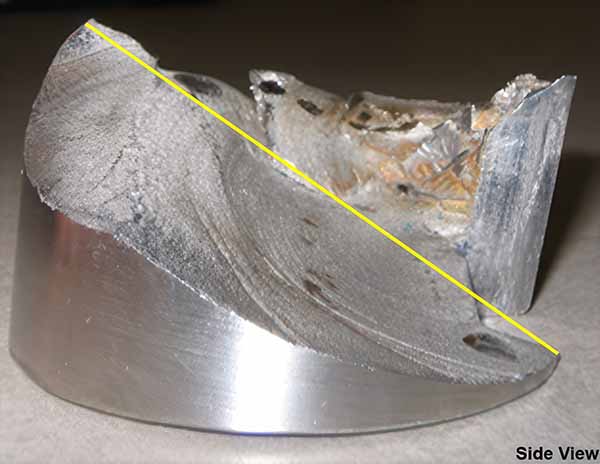
Figure 6: Shaft Side View
The information from the failed part also helps the investigator with the next data collection step. The question is, “How long was the shaft in service?” Why does this matter to us?
If the shaft had been in service for two years or more and the loads were minimal, what would need to change to cause the failure? Most investigative teams would likely be interested in any operational changes, possibly increasing throughput. Obtaining process data before and during the event would allow them to verify whether the throughput was increased or not.
Another possibility (hypothesis) is that shaft corrosion was present, severe enough to lower the material’s fatigue strength, which could cause failure at normal operating loads.
Let’s say the shaft was in service for only two days. What direction would be most logical to pursue now?
Usually, when the service time is short, investigative teams focus on data collection first, which is related to the shaft itself. Some concerns to investigate could include:
- Was the correct shaft installed?
- Was the shaft ordered from stores or stock?
- Was the shaft material correct for the service?
Obtaining the equipment specifications, maintenance manuals, drawings, etc., and comparing them to the actual shaft dimensions and chemistry would also help to validate the hypothesis.
The other direction would be to investigate everything about the installation. Some things of concern might be:
- Was the procedure followed?
- Was a procedure even used?
- Was it aligned properly?
- Was a baseline vibration signature performed after initial start-up?
These things are more wrapped around human installation errors.
Let’s move back to the logic tree and see if any of the possibilities can be eliminated. The part information provided from basic material failure allows the investigator to determine what did and did not happen.
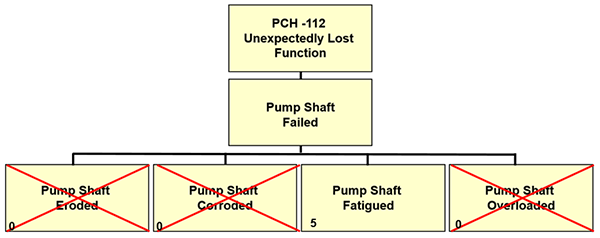
Figure 7. Updated Logic Tree Based on Evidence Collected
The hypothesis blocks also have a number in the bottom left-hand corner, which is what we call the ‘Confidence Factor’ of the verification method used. The ‘0’ indicates with 100% confidence that erosion, corrosion, and overload did NOT occur. The ‘5’ indicated with 100% confidence that fatigue DID occur (See Figure 7).
Since progression marks can only occur in fatigue failures, the lead investigator is 100% confident in the fatigue conclusion. Since there were no visual signs of erosion, corrosion, or overload, the lead investigator is 100% confident they did not occur.
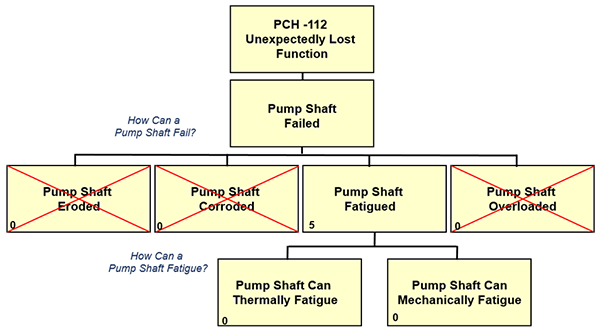
Figure 8: Continued ‘How Could?’ Questioning in the Logic Tree
The question now is, “How could the pump shaft be fatigued?” (Figure 8). There are only two kinds of fatigue: thermal and mechanical. To verify thermal or low-cycle fatigue, the analyst could view the part using a powerful microscope and visually see the effects of heat fluctuations. In this case, thermal fatigue signs were not present, so it was ruled out.
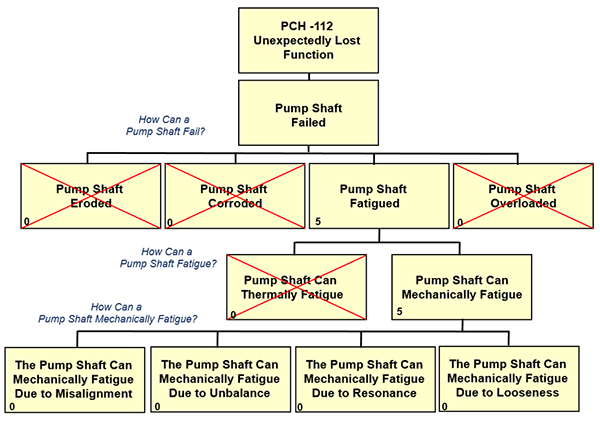
Figure 9: Updated Logic Tree Based on Evidence Collected
The “How could?” question is again applied, “How could the pump shaft have mechanically fatigued?” There are four possible all-inclusive hypotheses: Misalignment, Unbalance, Resonance, and Looseness.
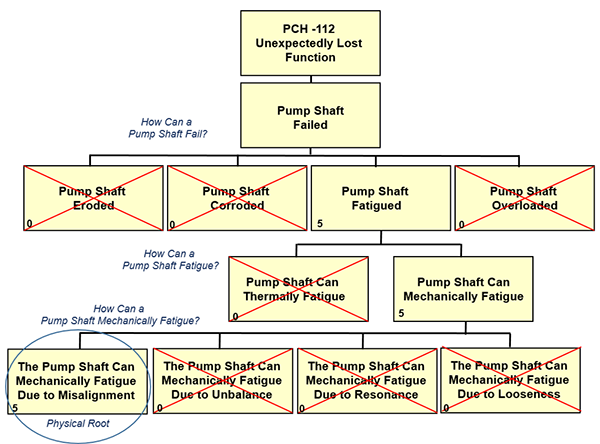
Figure 10: Drilling Down Through the Physics of Failure
This level can be verified using vibration data taken before the failure occurred. Vibration trend data is extremely valuable for verifying types of vibration. A vibration signature history can quickly validate all four hypotheses.
Misalignment doesn’t just reduce efficiency—it sets the stage for failure.
The results verify there was misalignment present before the failure. This becomes a physical root cause. If the misalignment were not present, the shaft would not have failed. The physical root was determined using a basic understanding of what the fracture surface was telling us.
Author’s Note: I want to thank my mentors, Neville Sachs, and Edward Sullivan, for teaching me how important it is to pay attention to the fractured surface and question everything about that surface. There are many things we have visually seen, like hammer marks, vise marks, chisel marks, welded nuts used as an additional set screw, and the like. The markings can tell a story about how much of a problem the equipment has been for maintenance.
Need help with RCA or have questions? Contact Bob Latino with Prelical.