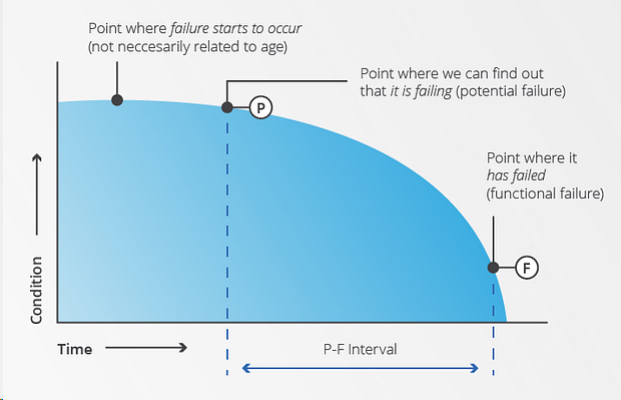
The P-F Interval represents the time between an asset’s Potential Failure (P) and Functional Failure (F). To understand this concept clearly, let’s break it down step by step, using an analogy related to everyday experiences.
The Analogy: The Warning Light on Your Car’s Dashboard
Imagine you’re driving a car, and one day, you notice a small warning light on the dashboard. This light doesn’t mean your car has completely failed; you can still drive it, but it’s a sign that something might be wrong. Over time, if you ignore this warning light, your car’s performance might start to degrade until it completely breaks down and stops working altogether.
In this analogy:
- Potential Failure (P): This is when the warning light first appears. It’s an early sign that something is wrong, but the car is still functional.
- Functional Failure (F): When the car finally breaks down and can no longer perform its intended function – getting you from point A to point B.
The P-F Interval is the time between these two points – from when the warning light first appears (P) until the car actually stops working (F).
Technical Breakdown
Potential Failure (P)
- This is the point in time when a fault is first detectable but before it has caused the asset to fail completely.
- In technical terms, this is often when minor symptoms, like unusual noises, vibrations, or small leaks, start to show. These symptoms are indicators that something isn’t right, but the equipment or system is still operational.
Functional Failure (F)
- This is when the asset can no longer perform its intended function. The failure is significant enough that the equipment must be repaired or replaced.
- At this point, the car’s engine might stall, or a manufacturing machine might stop working altogether.
The Interval (P-F Interval)
- The P-F Interval is crucial because it represents the window of opportunity for maintenance or repair. The longer this interval, the more time there is to detect and fix the fault before it leads to a total breakdown.
- This interval can vary depending on the type of asset, how it’s used, and how closely it’s monitored. For example, a well-maintained machine with regular inspections might have a long P-F Interval, giving plenty of time to address issues before they cause major problems.
Why is the P-F Interval Important?
The P-F Interval is a critical concept in proactive maintenance strategies. By understanding and monitoring the P-F Interval, organizations can:
- Predict Failures: By recognizing the signs of potential failure early, maintenance teams can intervene before a functional failure occurs.
- Schedule Maintenance: Instead of waiting for a machine to fail completely, maintenance can be scheduled during the P-F Interval, reducing unplanned downtime.
- Reduce Costs: Fixing a problem before it leads to a functional failure is usually less costly than dealing with a full breakdown, which might require more extensive repairs or even replacement of the asset.
Real-World Example
Consider an industrial pump that is crucial for a manufacturing process. If the pump starts to make a strange noise (P), this could indicate that a bearing is beginning to wear out. If this issue is detected and addressed during the P-F Interval, the bearing can be replaced before it fails completely. If the noise is ignored, the bearing might fail (F), causing the pump to stop working, which could halt production and lead to significant downtime and repair costs.

P-F Curve. Source Fiix
Understanding the P-F Curve
The P-F Interval is often represented graphically on the P-F Curve:
- The X-axis represents time.
- The Y-axis represents the condition or performance of the asset.
As time progresses from left to right, the curve starts at full performance, dips slightly at the point of potential failure (P), and then sharply drops to functional failure (F). The area between P and F on the curve is the P-F Interval.


