Over decades of observation, countless plants have closed their doors, often citing various causes, but the underlying issue was a failure to manage effectively with KPIs.
Management must shift from managing operations based solely on lagging metrics like cost, asset availability, and equipment downtime to a proactive approach centered on leading and lagging KPIs.
While valuable for evaluating performance, lagging indicators only reflect past actions and outcomes.
Organizations must manage the processes driving these results to thrive, adopting leading indicators to guide proactive, future-focused decision-making and avoid the pitfalls of reactive management.
Corporation costs may be too high to calculate, so we must stop these massive losses by implementing a plan to develop and align KPIs. This article may save someone’s plant or job, but do not look for shortcuts in the process because there are none.
Step 1.
Educate management, from executive to floor-level supervisors, on KPIs and how the leading and lagging indicators should be aligned to meet the business goals. Then, provide a similar education to the maintainers and operators.
Step 2.
Define and assess the current maintenance and reliability processes against a future state. A future state is formed of known maintenance and reliability “best practices.” As part of this assessment, develop a business case with financial opportunities and the costs of change. This step continues the education process and creates an awareness of the opportunity.
Step 3.
Develop a plan based on the assessment to include financial opportunities and costs on a timeline. This plan must include the following:
- Defining the maintenance and reliability process (work identification, planning, scheduling, work execution, etc.).
- Example: Preventive Maintenance (PM) – Actions performed on a time- or machine-run-based schedule that detect, preclude, or mitigate degradation of a component or system to sustain or extend its useful life through controlling degradation.
- The workflow process for each element in that process.
- The definition of roles and responsibilities for each task.
- The specification of leading and lagging KPIs in each element of the process.
- Targets and world-class benchmarks are established against the defined KPIs.

Preventive Maintenance Scorecard Example
Step 4.
Implement the process and begin managing based on leading indicators. Begin by measuring only a few KPIs (maximum of three). Then, allow people at the lowest levels to make the decisions required to ensure the maintenance and reliability process is proactive and effective. The use of leading KPIs is a great awareness tool and brings everyone into the decision-making process.
This process is not easy; however, it is not magic either. Developing KPIs is time-consuming but must be done for a company to survive.
Plant Management Team Dashboard

Definition of OEE for the plant manager
The plant management team consists of maintenance, production, purchasing, accounting, etc. The dashboard includes:
- Total cost per unit produced.
- Overall equipment effectiveness (OEE)––total plant (combination of all lines or production areas together providing a plant score).OEE, for the plant manager, is defined in the figure above and includes availability (running 24/7, loss is measured by calculating any action or inaction that takes away from this time period, this identifies the “hidden plant”); performance rate (the best rate ever sustained in a production process or design rate, whichever is greater); and quality rate (calculated as “first-pass quality” only).
Note: It is acceptable to have a low number in any of the categories. The objective of KPIs is to provide management with real numbers with which to manage and not to beat up people.
The plant management team consists of maintenance, production, purchasing, accounting, etc.
Maintenance Manager Dashboard
The maintenance manager’s dashboard has plant-level KPIs specific to the total plant maintenance and involves the maintenance cost per unit produced.
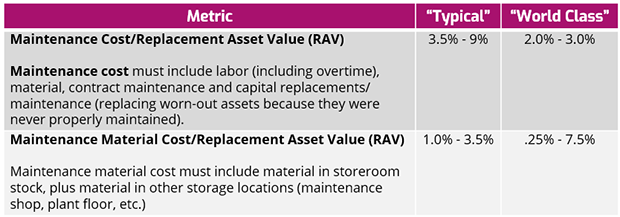
The following are measured as the maintenance cost of the return on asset value:
- MTBFF for the total plant.
- Maintenance labor cost (measured against a target).
- Maintenance material cost (measured against a target).
- Maintenance contractor cost (measured against a target).
- Percentage of overtime.
- Percentage of absenteeism.
- Number of discipline violations.
- Number of safety incidents.
- Number of days without loss-time accidents
- Number of environmental incidents.
- Number of Maintenance Rework
- Maintenance Cost by Asset (based on the World Class Maintenance \Model)
- Capital maintenance cost per unit produced.
- The maintenance supervisor’s dashboard has the same KPIs but at the level of that supervisor’s area of responsibility only and does not include the capital maintenance cost per unit produced.
Maintenance Stores Manager
- Number of stockouts.
- Number of times an employee waits longer than five minutes for parts ( 24/7).
- Inventory accuracy (standard = 99%).
- Maintenance material as a percentage of return on asset value (world-class = 0.25 to 0.75%).
- Percentage of stores preventive maintenance completed on time by month.
- Stores value by month.
Reliability Engineer Dashboard
- Bad actors report the top five critical assets with the highest total maintenance cost and worst reliability.
- MTBFF by production line and area.
- Percentage of critical assets with a maintenance strategy developed using an RCM methodology.
- Percentage of new assets with a maintenance strategy developed using an RCM methodology and ranked based on risk to the business.
Final Thoughts
Remove the black windshield and manage with leading indicators, not lagging ones. Leading KPIs should be used to drive the decision-making process. Remember, leading indicators (KPIs) are manageable, while lagging indicators only offer information on how well the plant was managed. To be the best, step up to the plate and manage in the most efficient manner by following these recommendations.
“If you can not measure it, you can not improve it.” – Lord Kelvin
Source: Rules of Thumb for Maintenance and Reliability Engineers by Ricky Smith / Keith Mobley

