

You’ve heard it in every reliability pitch deck, bad-actor program kickoff, and CMMS demo: 80% of your downtime comes from 20% of your assets. It sounds like a measurement. It gets quoted like one.
So we went looking for the study. This page traces where the 80/20 pairing came from, what the peer-reviewed maintenance literature says about downtime concentration, and how confident you should be in the number before you put it on a slide.
The short answer: the skew is real, the ratio is borrowed. We found no published dataset that validates a universal 80/20 split between assets and downtime, and the trail leads back to quality defects and Italian wealth curves, not plant floors.
Where the 80/20 rule comes from
Vilfredo Pareto studied the distribution of wealth in Italy in the 1890s and built mathematical models describing how a small share of the population held most of it. That was the full extent of his contribution to your maintenance backlog. He never generalized the pattern beyond economics.
The generalization came from Joseph Juran. Starting in the mid-1920s as a young engineer, Juran noticed that when quality defects were ranked by frequency, a relative few accounted for the bulk of the defectiveness. He saw the same pattern in absenteeism and accident causes. While preparing the first edition of the Quality Control Handbook (1951), he needed a short name for this universal and reached for Pareto’s, pairing his defect curves with Pareto’s wealth curves under one caption.
In May 1975, Juran published “The Non-Pareto Principle; Mea Culpa” in Quality Progress, confessing that he had applied the wrong name. Pareto’s models were built for wealth and were never intended for other fields. The universal, Juran wrote, was his own generalization, and the attribution stuck anyway.
Notice what’s missing from this entire chain: equipment downtime. The 80/20 pairing entered industrial language through quality defect counts and stayed there for decades. Its migration into “80% of downtime comes from 20% of assets” happened later, in trade content and sales material, without a dataset attached.
The Reliable Confidence Score
| Claim or Source | Figure | Reliable Confidence | What It Really Means |
|---|---|---|---|
| “80% of downtime comes from 20% of assets” as a measured benchmark | 80/20 | Lowno primary study | We found no published study that measures this ratio across plants or fleets. It circulates as a slogan inherited from quality management. |
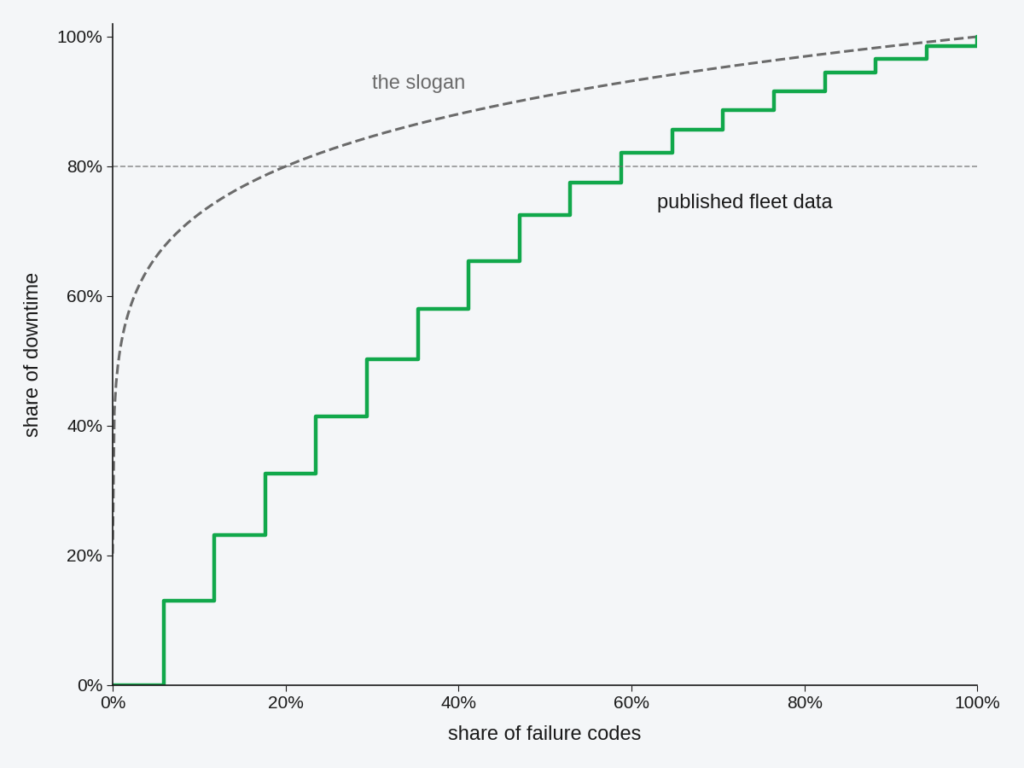
| Downtime concentrates heavily in a minority of failure codes and causes | Direction, not a ratio | Highpublished fleet data | Knights’ published mine fleet data confirms strong skew at the failure-code level, and analogous concentration appears in infrastructure criticality studies. Direct asset-level proof is thinner than the slogan implies. |
| Origin of the 80/20 pairing | Wealth curves and defect counts, 1890s to 1951 | Highprimary source | Juran generalized Pareto’s wealth observation to quality losses, then admitted misnaming the principle in a 1975 mea culpa. Downtime appears nowhere in the origin literature. |
| 80% as a cutoff line in the maintenance literature | An analysis convention | Highpeer-reviewed | Published maintenance papers use the 80% line as a place to stop ranking, not as a finding. In one published 13-shovel fleet, the 80:20 cutoff selected nine of seventeen failure codes, reaching 77.5% of downtime. |
| Vendor variants: 10% of assets drive 60 to 80% of spend; top 3 absorb 48% | 10/60 through 20/80 | Lowunsourced | The ratio drifts depending on who’s telling it, which is the signature of folklore. None of these versions cites a dataset. |
| A strict 80/20 split as a natural law | One point in a family | Higharithmetic | An exact 80/20 split corresponds to one specific member of a whole family of skewed distributions. Nothing obliges your plant to sit on that point. |
The Big Takeaway
Downtime concentration is one of the best-supported qualitative patterns in maintenance. Published fleet analyses support it: a minority of failure codes and causes carry a disproportionate share of the pain. Bad-actor programs work because of it.
The skew is real. The ratio is folklore. The whole point of Pareto analysis is to measure your own split, and quoting someone else’s defeats it.
The specific numbers are another matter. In the one place we found real fleet data run through a Pareto ranking, a published analysis of one month of unplanned electrical downtime across 13 cable shovels at a Chilean copper mine, the nine failure codes prioritized by the 80:20 rule accounted for 77.5% of downtime, and the tenth code was needed to pass 80%. Nine of seventeen codes. That is a long way from a vital few.
Why the numbers vary
The unit of analysis keeps changing. “80/20” gets applied interchangeably to assets, failure codes, work orders, downtime hours, and maintenance dollars. These are different distributions and they concentrate differently. A plant where 20% of assets consume 80% of maintenance spend can simultaneously have downtime spread across half the plant.
Fleet composition drives the split. Thirteen identical shovels produce a very different concentration curve than a mixed plant with one furnace, forty pumps, and three hundred valves. Homogeneous fleets flatten the curve; a single monolithic bottleneck asset steepens it.
Time windows move the ranking. Bad actors are not a permanent caste. A published critique of Pareto histograms in maintenance (Knights, 2001) argued that static rankings hide the variables that matter, failure frequency versus mean downtime per event, and proposed logarithmic scatterplots precisely because the simple ranked bar chart misleads.
The math never promised 80/20. An exact 80/20 split falls out of one specific Pareto distribution. Skewed distributions come in every steepness. Your plant’s curve is whatever your CMMS data says it is: 65/20, 80/35, 92/10.
Repetition mutates the figure. In current vendor content the claim appears as 20% of assets causing 80% of downtime, 10% of equipment consuming 60 to 80% of maintenance spend, and top-three assets absorbing 48% of corrective cost. Numbers that drift this freely are being quoted from memory, not from data.
How to use the 80/20 idea safely
- Treat Pareto as a method, never as a statistic. Run the ranking on your own work order history and report the split you measured: “eleven assets produced 74% of our downtime hours last year” survives scrutiny in a way “the 80/20 rule says” never will.
- Rank by more than one variable. Downtime hours, event count, and repair cost produce different top-ten lists. An asset that stops the line for five minutes twelve times a week may never crack the downtime ranking while quietly destroying schedule stability.
- Re-run the analysis on a fixed cadence. Once the current bad actors are fixed, the concentration re-forms around a new set. The list is a snapshot, and treating it as a standing verdict is how last year’s priorities eat this year’s budget.
- Don’t starve the tail. Safety-critical and protective equipment can sit in the “trivial many” for years precisely because it rarely fails. Juran himself renamed the trivial many the “useful many” for a reason.
Where teams go wrong
The most common failure is putting 80/20 in a business case as if it were a measurement. Any reviewer who asks “whose data?” collapses the slide, because there is no answer. The measured version of the same argument is stronger and takes one CMMS export to build.
The second failure is ranking on a single variable. A downtime-hours Pareto and a failure-count Pareto disagree, and acting on only one of them systematically ignores either the chronic nuisance failures or the rare catastrophic ones.
The third is using the slogan to justify neglect. “Focus on the vital few” becomes a license to strip preventive maintenance from the other 80% of the asset base, which is how next year’s bad actors get made. The cost of letting that happen compounds fast; see our industrial downtime cost benchmarks for what published studies say an unplanned hour is worth.
Methodology
We searched for any primary study, industry survey, or published multi-plant dataset that measures the share of unplanned downtime attributable to a given share of assets. We found none. We traced the origin of the 80/20 pairing through Juran’s own published account, confirmed the peer-reviewed maintenance literature that applies Pareto ranking to real fleet downtime data, and collected current examples of the claim as it circulates in vendor content.
The cumulative percentages quoted from the shovel dataset were recomputed by us from the raw table as reproduced in an open post-print of a peer-reviewed article, rather than taken on faith from secondary summaries. The Low ratings on this page rate confidence in the specific ratio as a benchmark, not in the underlying pattern of concentration, which is well supported at the failure-code level. A negative finding, no universal ratio exists in the published record we searched, is stated at High confidence because the searches were specific and repeatable.
The Short Version
Downtime concentrates. That part is real, published, and worth building a bad-actor program on. The 80/20 ratio attached to it is a slogan that migrated from quality management, where Juran coined it, admitted misnaming it, and never once applied it to equipment downtime. We found no study that validates the split. Run the Pareto on your own data, quote the number it gives you, and retire the borrowed one.
Sources
- Juran, J.M., “The Non-Pareto Principle; Mea Culpa,” Quality Progress, Vol. 8, No. 5, May 1975, pp. 8-9. Full-text reprint hosted by the Juran Institute: juran.com reprint (PDF) (the reprint header dates the piece 1974; ASQ’s journal record is May 1975)
- Juran, J.M., “Pareto, Lorenz, Cournot, Bernoulli, Juran and Others,” Industrial Quality Control, October 1950, p. 25 (cited within the mea culpa; not openly available)
- Knights, P.F., “Rethinking Pareto analysis: maintenance applications of logarithmic scatterplots,” Journal of Quality in Maintenance Engineering, Vol. 7, No. 4, 2001, pp. 252-263. https://doi.org/10.1108/13552510110407041
- Knights, P.F., “Downtime Priorities, Jack-Knife Diagrams and the Business Cycle,” Maintenance Journal, Vol. 17, No. 2, May 2004, pp. 14-21 (source of the 13-shovel electrical downtime dataset). ResearchGate record
- Seecharan, T., Labib, A. and Jardine, A., “Maintenance Strategies: Decision Making Grid vs. Jack-Knife Diagram,” Journal of Quality in Maintenance Engineering, Vol. 24, No. 1, 2018, pp. 61-78. https://doi.org/10.1108/JQME-06-2016-0023. Open post-print via the University of Portsmouth repository; reproduces the raw 13-shovel downtime and frequency table used for our recomputation.
- “Structural Vulnerability Analysis of Electric Power Distribution Grids,” arXiv:1506.08641. Cited as an analogous example of concentration in infrastructure criticality, not as direct evidence on maintenance downtime (over 80% of grid components carried under 1% criticality). https://arxiv.org/pdf/1506.08641
- Examples of the claim in circulation (cited as specimens, not sources): Fabrico, “Pareto Analysis for Downtime: The 80/20 Playbook”; Limble, “How to Track Downtime by Asset”; Oxmaint, “Identifying Bad-Actor Equipment in Power Plants with CMMS”