
TL;DR: FMEA (Failure Mode and Effects Analysis) is a structured method for identifying potential failures before they occur, evaluating their consequences, and prioritizing them for mitigation. The methodology rates each failure mode on three dimensions – Severity, Occurrence, and Detection – and uses either traditional RPN (Risk Priority Number = S × O × D) or modern Action Priority (AP) lookup tables to prioritize action. The AIAG-VDA 2019 harmonized handbook replaced RPN with AP for automotive FMEAs because RPN has documented mathematical problems. Most existing online content predates this change. The methodology has variants for product design (DFMEA), manufacturing process (PFMEA), system architecture (System FMEA), and service delivery, plus the quantitative extension FMECA used in aerospace and military. FMEA has real limitations – subjective scoring, paperwork-exercise risk, coverage gaps for interaction failures – and works best paired with complementary methods like Fault Tree Analysis. This guide walks through the seven-step AIAG-VDA approach, three worked examples at increasing complexity, the most common mistakes, and the honest limitations of the methodology.
The Short Answer
FMEA is a structured way to think about how things can fail before they fail. You break the system into pieces, identify the ways each piece can fail, evaluate the consequences, and prioritize the failure modes that need attention. The output is a ranked list of risks with associated mitigation actions.
The basic mechanics:
For each failure mode, rate three dimensions (1-10 each):
S = Severity (how bad is the consequence?)
O = Occurrence (how likely is the failure?)
D = Detection (how likely will we catch it before customer impact?)
RPN = S × O × D (traditional) | AP = High/Medium/Low (AIAG-VDA 2019)
The math is the easy part. The hard part is identifying the right failure modes, getting the team to score them honestly, and turning the analysis into actual improvements rather than a document that gets filed and forgotten.
The AIAG-VDA 2019 Seven-Step Approach
In 2019, the Automotive Industry Action Group (AIAG) and German Verband der Automobilindustrie (VDA) published a harmonized FMEA handbook that replaced earlier methodology with a seven-step approach. The structure has been widely adopted across automotive and increasingly in other industries because it produces more rigorous analysis than the looser approaches that preceded it.
- Plan and Prepare – Define scope, assemble cross-functional team, gather supporting documentation, set boundary conditions. Most FMEA failures originate here when teams skip preparation and start scoring failure modes without understanding the system.
- Structure Analysis – Break the system, design, or process into elements. For DFMEA, identify components and their relationships. For PFMEA, identify process steps and their sequence.
- Function Analysis – Document the intended function of each element. This is where most FMEAs go wrong – failure modes can only be identified relative to intended function, and unclear function definitions produce unclear failure modes.
- Failure Analysis – Identify potential failure modes for each function. Document failure effects (what happens when it fails), failure causes (why it fails), and current controls (what prevents or detects it).
- Risk Analysis – Rate Severity, Occurrence, and Detection on 1-10 scales. Calculate RPN or determine AP using the lookup table.
- Optimization – Develop corrective actions for high-risk failure modes. Document responsibility and target dates. Re-rate after actions are implemented to verify risk reduction.
- Results Documentation – Document the FMEA in a standard format. Treat it as a living document that updates as the system evolves.
The seven-step approach takes longer than informal FMEA approaches but produces more useful output. Operations that compress the methodology into “scoring sessions” that skip preparation, structure analysis, and function analysis typically produce FMEAs that miss obvious failure modes and over-rate the wrong ones.
The Rating Scales: Severity, Occurrence, Detection
Each failure mode gets three ratings on 1-10 scales. The scales are anchored to specific consequences and probabilities, though exact anchors vary by industry and standard.
Severity (S) – How Bad Is the Consequence?
Severity measures the impact of the failure if it occurs. The scale runs from 1 (no effect) to 10 (catastrophic). The anchors below illustrate the structure of the AIAG-VDA scales using automotive examples; the published AIAG-VDA 2019 handbook contains the authoritative tables with specific criteria differentiated for DFMEA and PFMEA contexts, and operations should reference the handbook directly for compliance work:
- 10 – Failure to comply with safety regulations or causes safety hazard (vehicle crash, fire, injury)
- 9 – Loss of primary function with safety impact (engine stops at highway speed)
- 8 – Loss of primary function (vehicle won’t start)
- 7 – Degraded primary function (vehicle starts but performs poorly)
- 6 – Loss of secondary function (radio doesn’t work)
- 5 – Degraded secondary function (radio works intermittently)
- 4 – Annoyance noticed by most customers
- 3 – Annoyance noticed by some customers
- 2 – Annoyance noticed by sensitive customers
- 1 – No discernible effect
Severity is the most objective of the three ratings because it depends on the failure consequence rather than failure probability. The same failure mode usually has the same severity regardless of how likely it is.
Occurrence (O) – How Likely Is the Failure?
Occurrence measures the probability of the failure mode occurring. The scale runs from 1 (extremely unlikely) to 10 (highly likely). The anchors below illustrate the scale structure; the published AIAG-VDA 2019 handbook contains the authoritative occurrence criteria with specific guidance on how to incorporate prevention controls and historical data into the rating:
- 10 – Failure inevitable, > 1 in 2 chance
- 9 – Very high, 1 in 3
- 8 – High, 1 in 8
- 7 – Moderately high, 1 in 20
- 6 – Moderate, 1 in 80
- 5 – Low, 1 in 400
- 4 – Very low, 1 in 2,000
- 3 – Remote, 1 in 15,000
- 2 – Very remote, 1 in 150,000
- 1 – Almost never, < 1 in 1,500,000
Occurrence is the most subjective rating because it depends on team estimates of failure probability, which often lack underlying data. Teams with access to failure history (FRACAS data, warranty data, historical FMEAs) produce more accurate occurrence ratings than teams scoring from intuition.
Detection (D) – How Likely Will We Catch It?
Detection measures the probability that current controls will catch the failure mode before it reaches the customer. The scale is inverted -— high numbers mean low detection probability. The anchors below illustrate the scale structure; the published AIAG-VDA 2019 handbook contains the authoritative detection criteria with specific guidance on evaluating control effectiveness:
- 10 – No detection capability, no controls
- 9 – Very remote chance of detection
- 8 – Remote chance of detection
- 7 – Very low detection probability
- 6 – Low detection probability
- 5 – Moderate detection probability
- 4 – Moderately high detection probability
- 3 – High detection probability
- 2 – Very high detection probability
- 1 – Detection almost certain
Detection is frequently misunderstood because the scale runs opposite to what intuition suggests. Higher detection numbers mean worse detection capability. This is intentional – it makes higher RPN values correspond to higher overall risk, including the risk of undetected failures.
RPN: The Traditional Approach
The traditional FMEA risk metric is RPN (Risk Priority Number), calculated as the product of the three ratings:
RPN = Severity × Occurrence × Detection
RPN ranges from 1 (1 × 1 × 1) to 1,000 (10 × 10 × 10). Traditional guidance was to act on RPN values above a threshold – often 100 or 125 – or on the top 10 to 20 percent of RPN values across the FMEA.
RPN has documented mathematical problems that have been criticized in reliability engineering literature for decades. Multiplying ordinal rating scales is statistically inappropriate, and the resulting numbers don’t behave the way the formula suggests. Different combinations of S, O, and D can produce the same RPN despite very different operational implications:
- S=10, O=2, D=5 → RPN=100 (catastrophic but rare and detectable)
- S=2, O=5, D=10 → RPN=100 (minor but undetectable)
- S=4, O=5, D=5 → RPN=100 (moderate everything)
All three of these failure modes have RPN=100, but they represent very different risk profiles. The catastrophic-but-rare failure mode probably needs more attention than the moderate-everything failure mode despite identical RPN. RPN-based prioritization can mask these distinctions and lead teams to focus on numerically-equivalent risks that aren’t operationally equivalent.
Action Priority: The AIAG-VDA 2019 Approach
The 2019 AIAG-VDA harmonized FMEA handbook replaced RPN with Action Priority (AP) for automotive FMEAs. Action Priority uses lookup tables rather than multiplication, weights severity more heavily than the other dimensions, and produces three discrete priority levels (High, Medium, Low) rather than a numerical scale.
The general AP logic, simplified:
- High AP – High severity (S=9-10) regardless of O and D, or high severity combinations with significant occurrence and detection ratings
- Medium AP – Moderate severity with high occurrence or detection issues, or specific S/O/D combinations defined in the lookup table
- Low AP – Low severity combinations or high severity with very low occurrence and very high detection
The full AP lookup table covers all 1,000 possible S/O/D combinations and assigns each to High, Medium, or Low. The methodology addresses RPN’s mathematical problems by:
- Eliminating multiplication of ordinal scales
- Weighting severity more heavily (high-severity failure modes always get attention regardless of probability)
- Producing categorical priorities that are easier to communicate than RPN numbers
- Reducing the appearance of false precision that RPN creates
Most modern automotive FMEAs follow the AP approach. Operations in non-automotive industries are migrating gradually – aerospace and medical devices have largely retained traditional approaches, while general manufacturing varies by customer requirements and internal standards.
Worked Example 1: Bicycle Brake System (PFMEA)
A simple PFMEA for one process step in bicycle brake assembly. The process step is “Install brake pad in caliper.”
Function: Securely attach brake pad to caliper such that pad can engage rim or rotor when brake is applied.
Failure Mode: Brake pad incorrectly oriented (installed backwards).
Failure Effect: Brake fails to engage properly. Significantly reduced braking performance. Potential customer safety issue if undetected.
Failure Cause: Operator confusion due to symmetric appearance of pad. No visual orientation aid on pad.
Current Controls: Visual inspection by operator. Functional brake test at end of assembly line.
Ratings:
- Severity = 9 (loss of primary function with safety impact – brakes don’t work properly)
- Occurrence = 4 (very low, ~1 in 2,000 assembly events based on historical data)
- Detection = 4 (functional brake test catches most cases but not all – visual inspection unreliable for this failure)
RPN = 9 × 4 × 4 = 144
Action Priority (AIAG-VDA 2019) = High (severity 9 with non-trivial occurrence and detection ratings)
Recommended Actions:
- Add asymmetric feature to brake pad (notch or color marking) so correct orientation is visually obvious
- Add poka-yoke fixture in assembly that prevents installation of pad in wrong orientation
- Improve functional brake test to catch cases the current test misses
Re-rate after actions implemented:
- Severity = 9 (unchanged – failure consequence is the same)
- Occurrence = 1 (poka-yoke makes incorrect orientation physically impossible)
- Detection = 2 (improved test catches near-100% of cases)
- New RPN = 9 × 1 × 2 = 18
- New AP = Low
This example demonstrates the basic FMEA flow: identify the failure mode, rate it, develop actions, verify risk reduction. Notice that severity didn’t change – the failure consequence is the same regardless of how unlikely we make it. Effective actions usually attack occurrence (prevent the failure) or detection (catch it before customer impact) rather than severity (which requires changing the design or process fundamentally).
Worked Example 2: Industrial Centrifugal Pump (DFMEA)
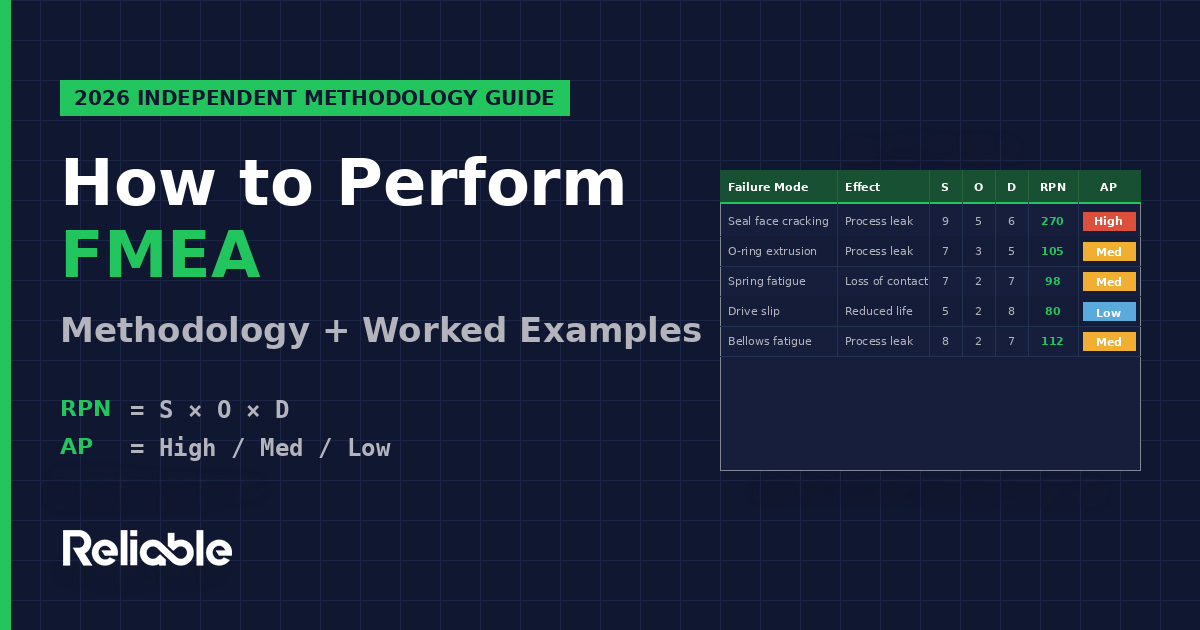
A more realistic DFMEA for a critical component on an industrial centrifugal pump used in chemical service. The component is the mechanical seal.
Component: Mechanical seal (cartridge type, single seal with API Plan 11 flush)
Function: Prevent process fluid from leaking past the rotating shaft to the atmosphere. Maintain seal integrity throughout the design service life of the pump.
Failure Modes Identified:
| Failure Mode | Effect | S | O | D | RPN | AP |
|---|---|---|---|---|---|---|
| Seal face thermal cracking | Process leak, potential HSE incident | 9 | 5 | 6 | 270 | High |
| O-ring extrusion (secondary seal) | Process leak, contained | 7 | 3 | 5 | 105 | Medium |
| Spring fatigue | Loss of seal face contact, leak | 7 | 2 | 7 | 98 | Medium |
| Drive mechanism slip | Reduced seal life, eventual leak | 5 | 2 | 8 | 80 | Low |
| Bellows fatigue (alternative design) | Process leak | 8 | 2 | 7 | 112 | Medium |
Notice how RPN and AP produce different prioritization. The seal face thermal cracking is the highest priority under both methodologies (severity 9 plus moderate occurrence and detection). But under RPN, the bellows fatigue (RPN=112) ranks higher than the spring fatigue (RPN=98) despite very similar risk profiles. Under AP, both are categorized as Medium, which more accurately represents their similarity.
Recommended Actions for High Priority (Seal Face Thermal Cracking):
- Specify silicon carbide vs carbon seal faces for higher thermal capability
- Upgrade flush plan from API Plan 11 to API Plan 23 (closed-loop cooling) for better thermal management
- Add seal face temperature monitoring to detect thermal stress before cracking occurs
- Specify seal selection criteria with explicit thermal margin for the service conditions
This example demonstrates how FMEA produces specific, actionable recommendations rather than just risk rankings. The rankings prioritize attention; the recommendations attack the underlying causes.
Worked Example 3: Common Mistakes Walkthrough
This example shows what FMEA looks like when it’s done badly – a pattern that’s distressingly common across operations that treat FMEA as paperwork rather than analysis.
The Setup: An automotive supplier needs to update their PFMEA for a customer audit. The team has 90 minutes scheduled. The FMEA was last updated two years ago and hasn’t been touched since.
Mistake 1: Skipping Steps 1-3 (Plan, Structure, Function). The team opens the existing FMEA spreadsheet and immediately starts re-rating failure modes without revisiting whether the system has changed, whether new failure modes have emerged, or whether the original function definitions are still accurate. The result is updated ratings on potentially obsolete failure mode lists.
Mistake 2: Severity Ratings Drift Down. The team unconsciously down-rates severity values to make the FMEA look better. A failure mode that was rated S=8 two years ago gets rated S=7 this year because “we’ve never actually had this failure happen at the customer.” Severity is supposed to measure consequence if the failure occurs, not historical occurrence rate. The down-rating produces RPN values that look better but don’t reflect actual risk.
Mistake 3: Detection Ratings Inflated. The team over-rates detection capability for current controls. A visual inspection that catches “most” defects gets rated D=2 (very high detection probability) when realistic field data would suggest D=4 or D=5. The inflation produces lower RPN values but doesn’t reflect actual detection performance.
Mistake 4: No Action on Existing High RPN Items. The previous FMEA identified three failure modes with RPN > 200. None of them have actions completed in the two years since. The current update simply re-rates them with the drift described above so they no longer exceed RPN > 100, eliminating them from the action list without addressing the underlying risks.
Mistake 5: No Cross-Functional Team. The “team” is one quality engineer updating the spreadsheet alone. The original FMEA was developed by a cross-functional team that no longer exists at the organization. The single-person update can’t represent the design, manufacturing, quality, and field perspectives that produced the original analysis.
The Audit Result: The FMEA passes the audit because the document exists, has appropriate columns filled in, and shows updated dates. But the document is functionally meaningless as a risk management tool. This pattern – FMEA-as-paperwork rather than FMEA-as-analysis – is one of the most common failure modes of the methodology itself, and it’s invisible until something fails in the field that the FMEA should have caught.
DFMEA vs PFMEA vs FMECA: The Variants Matter
Different FMEA variants apply to different aspects of the product lifecycle and have meaningful methodological differences.
DFMEA (Design FMEA) analyzes how a design can fail to perform its intended function. The analysis focuses on the design itself – components, materials, geometry, interfaces – rather than how the design is manufactured. DFMEA is performed during product development, ideally before design freeze. The DFMEA team typically includes design engineers, application engineers, manufacturing engineers (to flag manufacturability issues), and quality engineers.
PFMEA (Process FMEA) analyzes how a manufacturing or service process can fail to produce the intended output. The analysis focuses on process steps, equipment, parameters, and operator actions rather than the design being produced. PFMEA is performed during process design and updated throughout production as actual failures reveal new failure modes. The PFMEA team typically includes process engineers, manufacturing engineers, quality engineers, and production operators.
System FMEA analyzes interactions and integration at a higher level than DFMEA. The analysis focuses on subsystems and their interfaces rather than individual components. System FMEA is most useful for complex products with many interacting subsystems where component-level DFMEAs miss interaction failures.
Service FMEA applies the methodology to service delivery processes – customer support, field service, warranty repair, software-as-a-service operations. The analysis focuses on service process failures rather than product failures.
FMECA (Failure Mode, Effects, and Criticality Analysis) extends FMEA with quantitative criticality analysis. While FMEA produces qualitative or semi-quantitative risk rankings, FMECA produces quantitative criticality metrics typically based on failure rate data and severity classifications. FMECA originated in U.S. military reliability work and is formalized in MIL-STD-1629A. The methodology is used heavily in aerospace, military systems, and high-reliability applications where quantitative reliability prediction is required.
Industry Context: How FMEA Varies Across Industries
FMEA usage and methodology vary substantially across industries, and the variations matter for procurement decisions and supplier requirements.
Automotive (IATF 16949) requires both DFMEA and PFMEA as core tools, with the AIAG-VDA 2019 harmonized handbook serving as the reference methodology for automotive supplier FMEAs. Customer audits routinely review FMEAs, and customer-specific requirements often layer additional FMEA expectations beyond the AIAG-VDA baseline. Automotive FMEAs are among the most rigorous in any industry.
Aerospace (AS9100, MIL-STD-1629A) typically uses FMECA with quantitative criticality analysis rather than RPN-based FMEA. The aerospace approach relies on failure rate data from sources like MIL-HDBK-217 or NPRD-2016 to produce numerical criticality metrics. Safety-critical aerospace systems often require additional analyses (FTA, common cause analysis) beyond FMEA alone.
Medical Devices (ISO 14971) requires risk management aligned with ISO 14971, which uses FMEA as one of several acceptable methods. FDA 21 CFR 820 (Quality System Regulation) requires risk analysis for medical devices, with FMEA commonly used. The medical device approach typically emphasizes severity heavily because device failures can directly harm patients.
Pharmaceutical (ICH Q9) quality risk management uses FMEA as one of several risk assessment tools alongside HAZOP, fault tree analysis, and risk ranking and filtering. Pharmaceutical FMEAs apply to manufacturing processes, equipment qualification, and validated computer systems rather than product designs.
Process Industries (chemicals, refining, oil and gas) typically pair PFMEA with HAZOP (Hazard and Operability Analysis). HAZOP focuses on deviations from design intent in process operations and is particularly suited to continuous process operations. PFMEA covers what HAZOP doesn’t — equipment-level failure modes and maintenance considerations.
General Manufacturing varies widely. Customer requirements often drive FMEA adoption – operations supplying automotive customers use AIAG-VDA, operations supplying aerospace customers use FMECA, and operations without strong customer requirements often use simplified FMEA approaches that vary by company and consultant.
The Honest Critique: What FMEA Doesn’t Do Well
FMEA is a useful methodology but it’s not a complete reliability analysis tool. A few honest assessments worth flagging.
RPN is mathematically dubious. Multiplying ordinal rating scales is statistically inappropriate, and the resulting numbers don’t behave the way the formula suggests. Different combinations of S, O, D produce the same RPN despite very different operational implications. The AIAG-VDA 2019 Action Priority methodology was specifically designed to address this, but the migration is incomplete and many industries continue to use RPN due to legacy practice or customer requirements.
FMEA is subjective. Severity, occurrence, and detection ratings depend on team judgment and produce different results across different teams analyzing the same failure mode. Studies of FMEA inter-rater reliability have documented significant variation in RPN values across teams analyzing identical failure modes. Calibration exercises help but don’t eliminate the subjectivity. Quantitative methods like FMECA address this by replacing subjective ratings with failure rate data, but they require data that often doesn’t exist.
FMEAs frequently become paperwork exercises. Generated to satisfy ISO 9001 or IATF 16949 audit requirements rather than driving genuine improvement. The FMEA-as-paperwork pattern is widespread and almost invisible until something fails in the field that a real FMEA should have caught. The rigorous AIAG-VDA seven-step approach is partly designed to combat this by making the methodology too involved to fake convincingly.
Coverage gaps are common. FMEA tends to miss interaction failures, emergent system behaviors, and failure modes outside the team’s experience. Component-level DFMEAs miss system-level interaction failures. PFMEAs miss design-induced failures. System FMEAs miss component-level failure modes. The methodology works best when multiple FMEAs cover different aspects of the system rather than relying on one FMEA to find everything.
FMEAs are typically static. Most FMEAs are point-in-time documents that don’t evolve with the system, even though real systems change continuously. The “living document” intent is rarely achieved in practice because updating FMEAs is laborious and the urgency only appears when failures occur. Operations with mature reliability programs treat FMEAs as continuously updated work products; operations with weak reliability programs treat them as one-time deliverables.
Better paired with complementary methods. FMEA is bottom-up (cause to effects). Fault Tree Analysis (FTA) is top-down (effect to causes). HAZOP focuses on process deviations. FRACAS captures actual field failures. The methods are complementary rather than substitutes – operations relying on FMEA alone produce less robust reliability analysis than operations using multiple complementary methods.
FMEA and Related Reliability Methods
FMEA fits within a broader reliability analysis ecosystem that includes several complementary methods.
Fault Tree Analysis (FTA) is top-down analysis starting from a failure effect and working backward to identify combinations of causes. FTA complements FMEA – FMEA identifies failure modes, FTA identifies which combinations of failures cause specific top-level events. FTA is required for safety-critical systems in aerospace and nuclear industries.
HAZOP (Hazard and Operability Study) applies to process operations and identifies deviations from design intent (more flow, less flow, no flow, reverse flow, etc.). HAZOP is foundational in chemical and process industries and complements PFMEA by focusing on operational deviations rather than equipment failures.
FRACAS (Failure Reporting, Analysis, and Corrective Action System) captures actual field failures and feeds them back into reliability analysis. FRACAS data improves FMEA accuracy by replacing subjective occurrence estimates with actual failure rates.
RCM (Reliability-Centered Maintenance) uses FMEA as the analytical engine for Question 3 of the seven RCM questions (what causes each functional failure). RCM extends the FMEA output into a structured decision framework that classifies failure consequences into four categories – hidden, safety/environmental, operational, and non-operational – and then selects the appropriate maintenance task type for each failure mode. The methods are complementary: FMEA without RCM produces failure mode lists without maintenance strategy decisions; RCM without FMEA can’t identify the failure modes to analyze. See our RCM methodology guide for the full seven-question framework.
FMECA (Failure Mode, Effects, and Criticality Analysis) extends FMEA with quantitative criticality analysis based on failure rate data and severity classifications.
Weibull Analysis uses statistical methods to characterize failure distributions over time. Weibull analysis is appropriate for equipment with non-constant failure rates where MTBF and FMEA assumptions break down.
Common Mistakes in FMEA
The methodology is straightforward. The mistakes are everywhere. Seven common errors that produce misleading FMEAs:
1. Skipping the planning and structure phases. Jumping straight to scoring failure modes without defining scope, assembling the right team, or analyzing system structure. Produces FMEAs that miss obvious failure modes because the team doesn’t understand the system thoroughly.
2. Confusing failure mode, effect, and cause. The three are different. The failure mode is what happens (seal leaks). The failure effect is the consequence (process release). The failure cause is why it happened (thermal cracking). Confusion between these produces incoherent FMEAs.
3. Down-rating severity to make ratings look better. Severity measures consequence if the failure occurs, not historical occurrence. Down-rating severity because “we’ve never had this happen” misrepresents risk and undermines the analysis.
4. Inflating detection ratings. Over-rating the effectiveness of current controls. Visual inspection that catches “most” defects is not D=1; realistic field data typically suggests D=4 or higher for most visual inspection processes.
5. No cross-functional team. Single-person FMEAs miss perspectives that produce comprehensive analysis. Quality engineers can’t fully represent design, manufacturing, and field service perspectives. The cross-functional team is part of what makes FMEA work.
6. No re-rating after actions. The FMEA process requires verification that implemented actions actually reduced risk. Operations that develop actions but don’t re-rate after implementation can’t verify whether the actions worked.
7. Treating FMEA as a one-time deliverable. FMEAs should be living documents that update as systems change. Operations that produce FMEAs for audit compliance and never update them produce documents that diverge from operational reality over time.
Frequently Asked Questions
What is FMEA?
FMEA (Failure Mode and Effects Analysis) is a structured method for identifying potential failures in a system, design, or process before they occur, evaluating their consequences, and prioritizing them for mitigation. The methodology rates each failure mode on Severity, Occurrence, and Detection scales and uses RPN or Action Priority to prioritize action. FMEA applies to product designs (DFMEA), manufacturing processes (PFMEA), system architectures (System FMEA), and service delivery (Service FMEA).
What is the difference between RPN and Action Priority in FMEA?
RPN (Risk Priority Number) is the traditional FMEA metric calculated as Severity × Occurrence × Detection, producing values from 1 to 1,000. Action Priority (AP) is the modern AIAG-VDA 2019 approach using lookup tables to produce High/Medium/Low priorities. AP addresses RPN’s mathematical problems – multiplying ordinal scales is statistically inappropriate, and different S/O/D combinations can produce the same RPN despite very different risk profiles. Most modern automotive FMEAs use AP. Many other industries continue to use RPN.
What is the difference between DFMEA and PFMEA?
DFMEA analyzes product or system designs to identify failure modes before manufacturing. PFMEA analyzes manufacturing or service processes to identify failure modes during production. DFMEA focuses on design failures; PFMEA focuses on process failures. Both follow the same general methodology but apply to different aspects of the product lifecycle.
What is FMECA and how does it differ from FMEA?
FMECA extends FMEA with quantitative criticality analysis based on failure rate data and severity classifications. While FMEA produces qualitative or semi-quantitative risk rankings, FMECA produces quantitative criticality metrics. FMECA originated in U.S. military reliability work, is formalized in MIL-STD-1629A, and is used heavily in aerospace, military, and high-reliability applications.
When was FMEA developed?
FMEA was developed by the U.S. military in the late 1940s. NASA adopted it for the Apollo program in the 1960s. Ford introduced FMEA into automotive product development in the 1970s. AIAG published the first FMEA handbook in 1993. The 2019 AIAG-VDA harmonized handbook introduced the seven-step approach and Action Priority methodology that defines modern automotive FMEA practice.
What are the criticisms of FMEA?
RPN is mathematically dubious because it multiplies ordinal rating scales. FMEA is subjective with significant variation across teams. FMEAs frequently become paperwork exercises generated for audit compliance. Coverage gaps are common because FMEA tends to miss interaction failures and emergent behaviors. FMEAs are typically static documents that don’t evolve with the system. The methodology works best paired with complementary methods like FTA, HAZOP, and FRACAS rather than used alone.
Is FMEA required by ISO 9001 or IATF 16949?
ISO 9001 doesn’t specifically require FMEA but does require risk-based thinking and risk management. IATF 16949 (automotive) effectively requires both DFMEA and PFMEA, with the AIAG-VDA 2019 handbook as the reference methodology. AS9100 (aerospace) requires risk management that typically includes FMEA or FMECA. ISO 13485 (medical devices) requires risk management aligned with ISO 14971, which uses FMEA as one acceptable method.
How long does an FMEA take to complete?
FMEA duration varies with scope and complexity. A simple PFMEA might take 4-8 hours. A comprehensive DFMEA for a new automotive component typically requires 40-100 hours of cross-functional team time across multiple sessions. System-level FMEAs can require 200+ hours. The AIAG-VDA seven-step approach is designed to manage this through distinct phases, and compressing the methodology into too few sessions produces incomplete analysis.
Related Guides
- How to Perform RCM: Reliability-Centered Maintenance Methodology
- How to Calculate OEE: Methodology and Worked Examples
- How to Calculate MTBF and MTTR: Methodology and Worked Examples
- Best CMMS Software 2026: Independent Comparison
- Best Asset Performance Management Software 2026
- APM vs CMMS: What’s the Difference, and Which One Do You Need?
Sources
- AIAG-VDA Failure Mode and Effects Analysis Handbook (2019)
- SAE J1739 – Potential Failure Mode and Effects Analysis
- MIL-STD-1629A – Procedures for Performing a Failure Mode, Effects and Criticality Analysis
- IEC 60812 – Analysis Techniques for System Reliability — Procedure for Failure Mode and Effects Analysis (FMEA)
- ISO 14971 – Application of Risk Management to Medical Devices
- ICH Q9 – Quality Risk Management (Pharmaceutical)
- IATF 16949 – Automotive Quality Management System Standard
- AS9100 – Aerospace Quality Management System Standard
- “The Basics of FMEA” by Robin McDermott, Raymond Mikulak, and Michael Beauregard
- “Effective FMEAs” by Carl Carlson
- SMRP Best Practices – Society for Maintenance and Reliability Professionals
- Reliable Magazine independent editorial analysis
Last updated: May 2, 2026. This guide is editorial analysis by Reliable Magazine.