

Weibull analysis is a handy statistical tool for figuring out why things break, when they’ll break, and how reliable they are. This article looks at the groundwork laid down by Waloddi Weibull in the mid-20th century and explores this flexible distribution that can handle all sorts of different failure patterns.
We’ll dig into the main Weibull parameters—the scale and shape parameters—and what they mean for understanding failure data and planning out maintenance. Plus, we’ll cover different ways to calculate these parameters, what data you need, and some common mistakes to avoid when doing Weibull analysis, stressing how important good data and solid interpretation are for reliable results.
Weibull analysis doesn’t just model failure—it tells you when and why it strikes.
Predicting component and system failures is critical to effective engineering and maintenance management. A significant advancement in this field emerged from the work of Swedish engineer and mathematician Waloddi Weibull. His research in the mid-20th century, particularly his publications in 1939 and 1951, established the foundation for Weibull analysis, a powerful statistical technique for characterizing failure data.

Before Weibull’s contributions, failure analysis often relied on simpler distributions that frequently proved inadequate for modeling the complexities of real-world failure phenomena, especially those exhibiting non-constant failure rates. Recognizing these limitations, Weibull developed a more adaptable distribution accommodating a broader spectrum of failure behaviors.
The Weibull distribution offers a robust framework for quantifying the probability of failure as a function of time. Its incorporation of adaptable parameters allows it to be tailored to specific failure modes and product life cycle stages, proving to be a valuable asset across diverse industries.
Initially met with cautious evaluation, Weibull’s methodology gradually gained prominence as its practical utility in predicting product lifespans, assessing reliability, and optimizing maintenance schedules became evident.
The increasing availability of computational tools further facilitated the adoption of Weibull analysis. Today, it remains a cornerstone of reliability engineering, enabling organizations to make data-driven decisions that enhance safety, reduce operational costs, and improve overall system performance.
Deciphering the Weibull Parameters: η (Eta) and β (Beta)
At the core of Weibull analysis are its defining parameters, notably the scale parameter, η, and the shape parameter, β. A clear understanding of these parameters is essential for extracting meaningful insights from failure data.
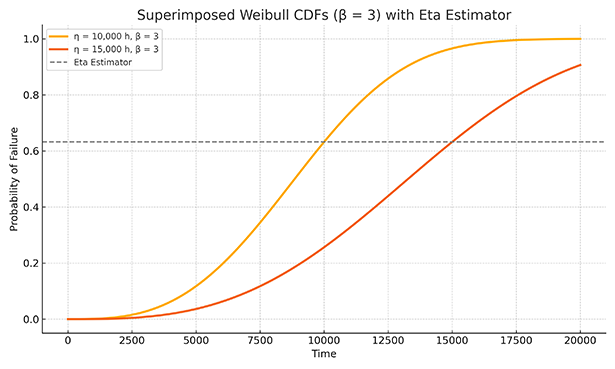
The scale parameter, η (eta), often termed the characteristic life, represents the time at which approximately 63.2% of the units within a population are expected to have failed. This specific percentage is a direct consequence of the mathematical formulation of the Weibull cumulative distribution function (CDF).
A larger η indicates a longer characteristic life, suggesting a tendency for failures to occur later. Conversely, a smaller η implies a shorter characteristic life and earlier failures. The units of η are consistent with the units of the failure data. It serves as a temporal benchmark for the failure distribution.
The shape parameter, β (beta), provides critical information about the failure distribution’s form and the failure rate’s evolution over time. This dimensionless parameter offers qualitative insights into the dominant failure mechanisms and the stages of a product’s life cycle. As elaborated in subsequent sections, different ranges of β correspond to distinct failure rate trends and necessitate tailored maintenance strategies.
Collectively, η and β form a robust two-parameter model for characterizing failure data. By accurately estimating these parameters from observed failure times, engineers can gain valuable perspectives on product reliability, informing decisions related to design enhancements, maintenance planning, and warranty assessments.
Interpreting Shape Parameters for Informed Maintenance Strategies
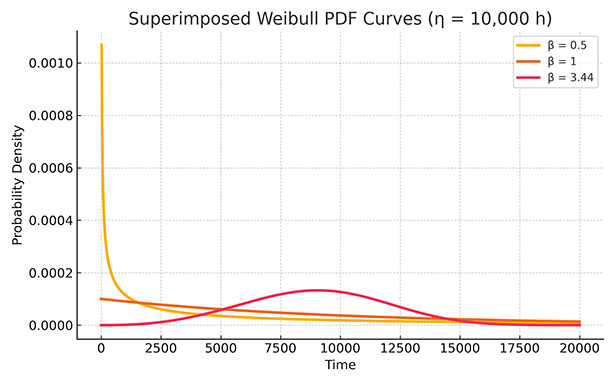
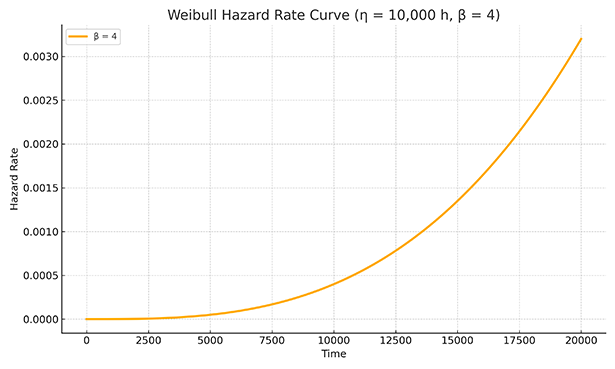
The shape parameter β is instrumental in understanding a population’s instantaneous failure or hazard rate. The hazard rate, h(t), quantifies the probability of failure at a specific time, t, given survival up to that point. The value of β directly dictates the temporal behavior of this hazard rate, providing essential guidance for developing effective maintenance protocols.
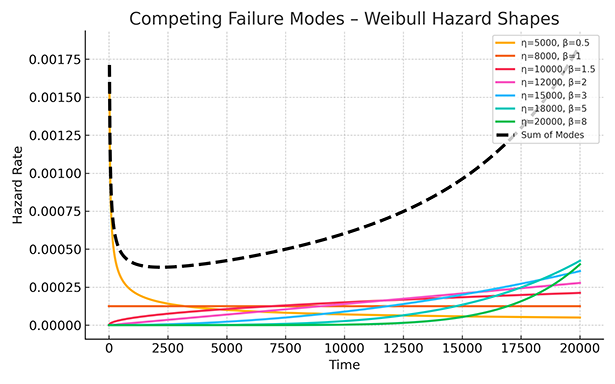
β<1: Decreasing Hazard Rate (Early Failures)
A shape parameter β less than 1 indicates a decreasing hazard rate over time. It is often associated with early failures stemming from manufacturing defects, quality control issues, improper installation, or initial design weaknesses. As these vulnerable units fail early, the remaining population becomes more resilient, leading to a decline in the overall failure rate.
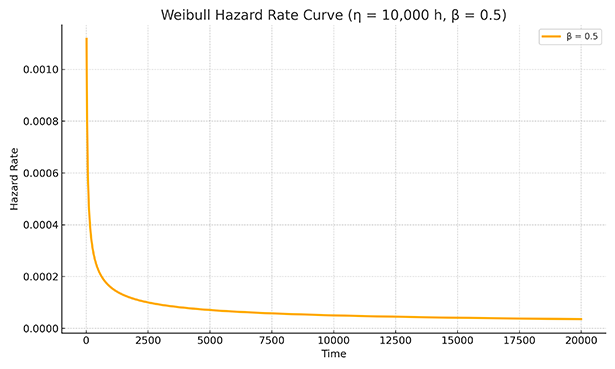
Maintenance Implications: For components exhibiting a decreasing failure rate, proactive measures early in their operational life are most effective in mitigating these initial failures. Strategies such as rigorous burn-in testing, comprehensive initial inspections, and early replacement of suspect components can significantly enhance system reliability. Predictive maintenance may be less critical during this phase. Infant failures have a special cause and will benefit from using RCA to determine the special cause.
β=1: Constant Hazard Rate (Random Failures)
A shape parameter β equal to 1 signifies a constant hazard rate, characteristic of random failures resulting from unpredictable events or stresses unrelated to age or operating time. The exponential distribution is a specific instance of the Weibull distribution where β=1.
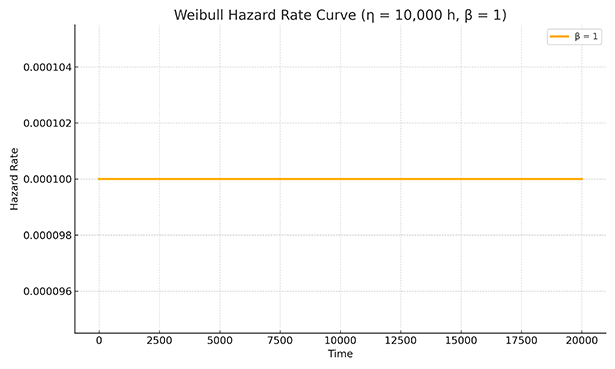
Maintenance Implications: For components with a constant failure rate, age-based preventive maintenance may not be the most efficient approach and may lead to higher maintenance costs without reducing the number of failures. Condition-based monitoring and predictive maintenance techniques become more valuable, enabling proactive intervention based on actual condition rather than time in service.
β>1: Increasing Hazard Rate (Wear-Out Failures)
A shape parameter β greater than 1 indicates an increasing hazard rate with time, typical of wear-out failures driven by degradation mechanisms such as fatigue, corrosion, wear, and aging. As operational time or cycles accumulate, the probability of failure increases. A shape parameter less than 4 indicates early wearout.
Maintenance Implications: Preventive maintenance strategies are crucial for components exhibiting an increasing failure rate. Scheduled replacements or overhauls at determined intervals can effectively prevent failures.
The optimal maintenance interval can be derived from the Weibull parameters, balancing maintenance costs with failure risks. Predictive maintenance can also provide early warnings of impending failure, allowing for timely intervention, mainly when early wear-outs occur.
Understanding the implications of the shape parameter is vital for aligning maintenance strategies with the equipment’s specific failure characteristics, optimizing resource allocation, and minimizing downtime.
Methods for Calculating Weibull Parameters
Estimating the Weibull parameters η and β from failure data is central to Weibull analysis. Several methodologies exist for this estimation, each with its strengths and limitations, often depending on the nature and size of the dataset.
- Graphical Methods (Probability Plotting): Historically significant and still valuable for visual assessment, graphical methods involve plotting failure data on specialized Weibull probability paper. The transformed axes of this paper cause the Weibull CDF to appear as a straight line. Parameter estimates are derived from the slope (related to β) and intercept (related to η) of the fitted line.
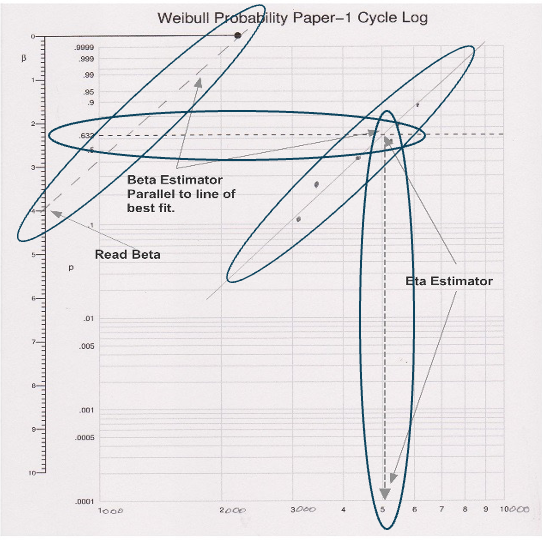
- While offering a visual check of the data’s fit to the Weibull distribution, graphical methods can introduce subjectivity due to the manual fitting of the line.
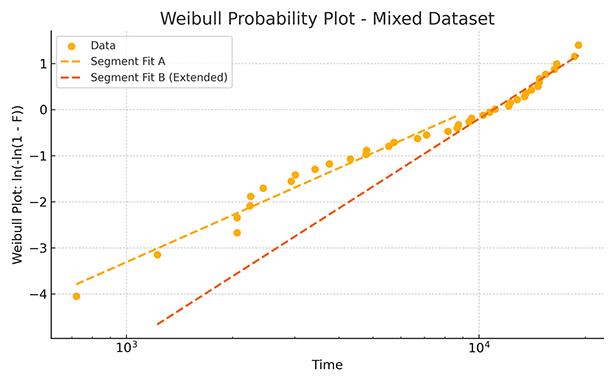
- Analytical Methods (Least Squares Estimation): Analytical methods employ mathematical techniques to enhance objectivity. A common approach involves linearizing the Weibull CDF through logarithmic transformations and applying the least squares method to fit a line to the transformed data. This minimizes the sum of squared errors between the data and the fitted line, providing more consistent parameter estimates.
- Maximum Likelihood Estimation (MLE): Maximum likelihood estimation is a statistically rigorous and widely preferred method, particularly for datasets containing censored data. MLE involves constructing a likelihood function representing the probability of observing the given failure data as a function of the Weibull parameters. The parameter estimates are then chosen to maximize this likelihood function. MLE generally yields more efficient and accurate estimates, especially for larger samples and with censored data.
Modern statistical software packages have streamlined the parameter estimation process. They implement sophisticated algorithms for MLE and other methods and provide users with parameter estimates, confidence intervals, and goodness-of-fit statistics.
Essential Data Requirements for Robust Weibull Analysis
The quality and characteristics of the failure data are paramount for obtaining reliable results from Weibull analysis. Accurate and representative data are fundamental for precise parameter estimation and subsequent predictions. Key data requirements include:
- Accurate Failure Times: It is essential to keep precise records of failure times, measured in relevant units (e.g., operating hours, cycles).
- Failure Modes (Desirable): Recording each event’s specific failure mode can provide deeper insights, as different failure modes may follow distinct Weibull distributions.
- Handling Censored Data: Proper accounting for censored data (right-, left-, or interval-censored) is crucial for unbiased parameter estimation. Methods like MLE are designed to handle such data.
- Sufficient Sample Size: A larger number of observed failures generally leads to more reliable parameter estimates and reduced uncertainty.
- Independence of Failures (Ideal): Basic Weibull analysis assumes statistical independence among failure events. Dependent failures may require more advanced techniques.
Meticulous data collection and management are integral to Weibull analysis’s success, ensuring the reliability of the derived insights.
Common Pitfalls in Weibull Analysis
Despite its utility, Weibull analysis is susceptible to misuse. Recognizing and avoiding common mistakes is crucial for accurately and effectively applying the technique.
- Unverified Distribution Assumption: Assuming a Weibull distribution without performing goodness-of-fit tests can lead to inaccurate conclusions if the data does not adequately conform to the model.
- Ignoring Censored Data: Discarding censored data can introduce bias into parameter estimates, typically underestimating the actual life of components. This error will lead to overspending on maintenance.
- Drawing Strong Conclusions from Small Samples: It is possible to draw conclusions from small samples, but great care should be taken to avoid making critical decisions based on them. Parameter estimates derived from small datasets have higher uncertainty, and critical decisions should be made with caution, acknowledging these limitations.
- Over-reliance on Point Estimates: Failing to consider the confidence intervals around parameter estimates can lead to overconfidence in the results.
- Oversimplifying Shape Parameter Interpretation: The shape parameter β provides nuanced information beyond indicating increasing, decreasing, or constant failure rates. Its specific value offers insights into the nature of the failure mechanism.
- Extrapolation Beyond Data Limits: Using the fitted Weibull model to predict failures significantly outside the range of the observed data can yield unreliable results.
Awareness of these common mistakes is essential for leveraging the full potential of Weibull analysis and making informed engineering and maintenance decisions.
Final Takeaways on Weibull Analysis and Its Impact
Weibull analysis remains a fundamental tool in reliability engineering, offering a versatile framework for modeling diverse failure patterns. By effectively utilizing its scale and shape parameters, organizations can gain critical insights into the life cycle of their assets, enabling the optimization of maintenance strategies, the improvement of product designs, and the enhancement of overall system reliability and safety.
Adherence to sound data collection practices and an awareness of potential pitfalls are crucial for maximizing the benefits of this powerful analytical technique. The enduring legacy of Waloddi Weibull provides a valuable methodology for understanding and mitigating the complexities of failure.