
One of the most frequently quoted studies related to electric motor reliability is a 1983 Electric Power Research Institute (EPRI) project performed by General Electric (1). It has been used to support various programs, equipment, and other electric motor strategies.
In fact, this author has cited other papers that referenced the study over many years and has been searching for a copy of the original to provide additional detail.
Recently, the paper covering the study’s details was made available through the Institute of Electrical and Electronics Engineers, Inc. (IEEE). A review quickly identifies that many of the statements attributed to the study are either incomplete or entirely incorrect.
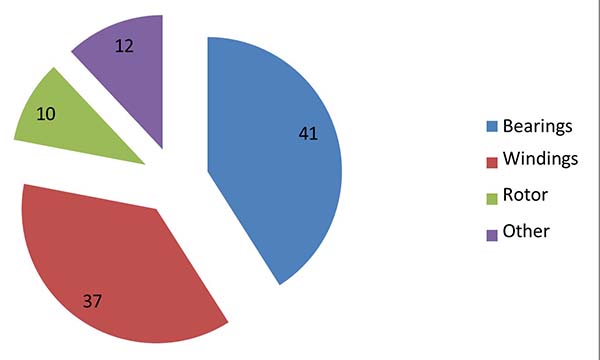
Figure 1: 1983 EPRI Study Failure Rates (1)
The good news is that this was not the only study on electrical systems and electric machine reliability. Studies were performed by several groups, including an IEEE Power Engineering Society group, from 1962 through 1995, and then supported by other industry groups as late as 2010.
These studies are particularly interesting because they focus on different industries, such as petrochemical, utilities, general industry, and commercial buildings, yet have very similar results.
While each study looked deeper into the issues, and the results were different from those represented by many papers and books, the actual findings were much more interesting and far more supportive of the programs and strategies presented in those cases.
In this article, we will review what these studies represent in relation to larger machines, which was the primary purpose of many of the papers. This includes the identified reliability issues and the recommended strategies, with supporting information. While the full breadth of the related studies are far more than we can cover in this article; the information discussed will significantly impact how you look at your motor system.
A Little About the EPRI Study
The percentages shown in Figure 1 have often been cited as the conclusion of the EPRI study, which is correct. However, the details behind those percentages are also very interesting. This includes the number of motors that failed more than once, the apparent causes of those failures, and the general reliability of electric motors in utilities.
First, it was noted that more than 90% of the failures occurred in 54% of the facilities evaluated, and half of the failures occurred in 17% of the facilities.
Most failures occurred in just 17% of facilities.
This means most failures occurred in less than half of the facilities evaluated. Overall, the reliability of the motors across all of the facilities was 3.4% per motor per year, with some facilities having an obviously higher failure rate, and 46% of facilities having a very low failure rate.
In all, the study found that the plants with the highest failure rates had a failure rate of 9.3% per year (17% of facilities) and that 13% of facilities had about a 0.8% failure rate.
The study evaluated 4,797 motors, with 1,227 failures on 872 motors. This means that 335 of the 1,227 failures were repeat failures. The best facilities saw some of the motors fail two to three times. The median group saw motors fail four or more times, and the worst group saw an even higher repeat failure rate.
The apparent causes of failure were also surprising, with only 34.1% of failures being from misapplication or misoperation. However, more than half (50.2%) of the failures were not specified with an apparent cause. The failure modes were correctly identified, with the repeated failures being the same as the original failures. Table 1 identifies the failures and the percentage of each failure mode.
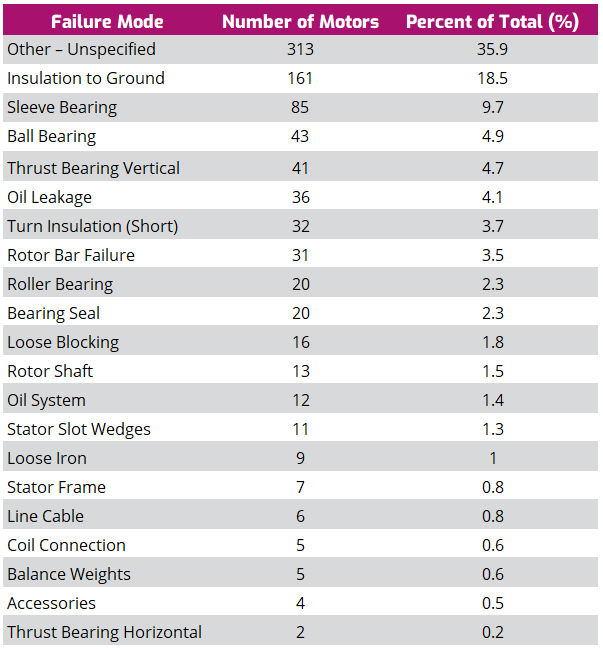
Table 1: Failure Modes (1)
Of these failures, design was determined to be 39.1%, and workmanship was 26.8%. The survey determined that 65.9% of the motor failures were related to the manufacturer and rebuilder.
65.9% of motor failures were tied to the manufacturer or rebuilder.
The failure rate by manufacturer was found to range from 0.84% to 5.27% for the top seven manufacturers, 16.44% for one manufacturer, and a combined total of 6.50% for all other manufacturers. The manufacturers were not identified.
One issue brought to light by the statistics in the EPRI study is that insulation to ground faults are the majority of winding faults. Quotes related to this study and other industry statements identify turn faults as the initiation of failure. However, that statement is not found in the reports in this or the follow-up studies.
Review and Comparison of Studies
Motor failure studies in the 1980s determined that a given population of motors had either an average failure rate of 0.0708 Failures per Unit per Year (FPU) for general industry (2) or 0.035 FPU for maintenance-intensive industries such as utilities (1).
In 1995, new studies would support the original assumptions. These industry studies found that in machines with required minimum protection, such as fuses or breakers, the failure rate was 0.0707 FPU, while those with embedded thermal protection had a failure rate of 0.0202 FPU, or less than 1/3 of the failures (3).
Maintenance was also found to have a significant impact in all of the studies. When maintenance frequency was involved, the post-EPRI studies found that frequencies of less than a year had the best impact.
The 1985 IEEE study identified that maintenance performed with a frequency under 12 months equaled 0.0124 FPU; from 13 to 24 months had 0.0506 FPU; maintenance frequency greater than 25 months resulted in 0.0881 FPU.
Maintenance under 12 months cut failure rates to 0.0124 FPU.
Machines that were maintained within the 12-month period were also found, within the survey, to have excellent practices, resulting in the failure rate of 0.0124 FPU, while all others had failure rates in excess of 0.0681 FPU.
A key difference between the EPRI and IEEE studies is that the IEEE 1985 study reviewed the general failures and broke out service factor, speed, and maintenance. The IEEE 1995 study further modified the findings by identifying size and voltage in order to determine factors that relate to each. In 2010, a paper on root cause failure analysis supported the findings of the 1995 study (4).
One consideration for these studies is their age; do the results change over time? From the first study published in 1974 on the electrical reliability of electrical equipment in industrial plants through the 1995 study, fundamental facts have not changed regarding the reliability of machines based upon application, enclosure, service factor, speed, protection, and level and type of maintenance.
The combined studies cover virtually all industries, from petrochemical and chemical to utilities to commercial and industrial applications.
Application of Studies to Large Machines
The studies provided similar data based on failure rates. Since it can be assumed that the variations in failure rates and reliability of machines by facility in the EPRI study relate to the level of maintenance, we will focus on the information in the IEEE studies. This information is broken down by size, enclosure, and speed, allowing us to demonstrate the importance of maintenance on large machines.
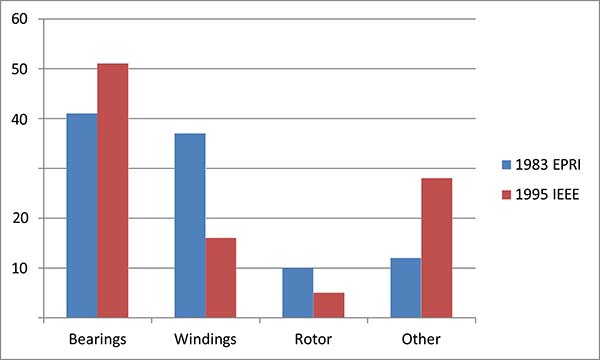
Figure 2: Comparison of 1983 EPRI to 1995 IEEE Survey (1), (3)
The primary difference is identified in Figure 2, where the various faults found in the machines were significantly different. It is noted that the EPRI study focused on utility motors 100 horsepower and larger, while the IEEE study related to machines of 10kW (~15hp) and larger at 50 Hz and 60 Hz.
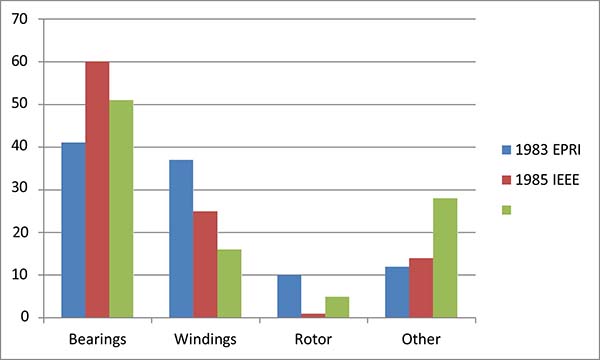
Figure 3: Comparison of the 1983 EPRI and the 1985 and 1995 IEEE Surveys (1), (2), (3)
As shown in Figure 3, the actual failure modes for each industry group were significantly different, except for a similar pattern. A majority of faults were caused by bearings, followed by windings as the second cause, then the rotor, and then all other faults combined.
The 1985 IEEE survey covered industrial and commercial facilities, the 1983 EPRI study covered utilities only, and the 1995 IEEE survey covered petrochemical and similar industries. Other significant differences with the 1985 survey are that it covered machines from 200 horsepower to 10,000 horsepower, voltages to 13.8kV, and induction, synchronous, wound rotor, and DC motors.
Based on the breadth of industries covered, we will review the following data as it relates to the 1985 IEEE survey and machines over 1,000 Volts. From an overall industry standpoint, 2300 and 4160 Vac machines have a median failure rate of 0.0714 FPU for induction motors, 0.0762 FPU for synchronous motors, and 0.0319 FPU for wound rotor motors.
If we further break down the information from the survey, motors from 500 to 5000 horsepower had a median failure rate of 0.0730 FPU, and from 5001 to 10,000 horsepower, a median failure rate of 0.2169 FPU.
In relation to motor speed and failure rate: 0-720 RPM is 0.1004 FPU; from 721-1800 RPM is 0.0721 FPU; and 1801-3600 RPM is 0.0519 FPU. In effect, larger, slower speed motors have a higher failure rate, with most machines being induction and synchronous motors in the survey. The wound rotor machines covered tended to be smaller in horsepower.
Based on the IEEE studies, continuous monitoring, such as temperature and vibration, can reduce the failure rate by about 1/3. None of the studies has identified the effect of partial discharge testing on machines over 6,000 Volts. However, it can be assumed that such practices and technologies are used for fault detection rather than winding protection, in most cases. Does this have an impact.
The IEEE studies identify the number of faults detected by various technologies and maintenance practices and the median downtime hours per failure based upon whether the fault was detected as part of a maintenance practice or during operation. According to the 1985 IEEE survey, the failures were detected as found in Figure 4.
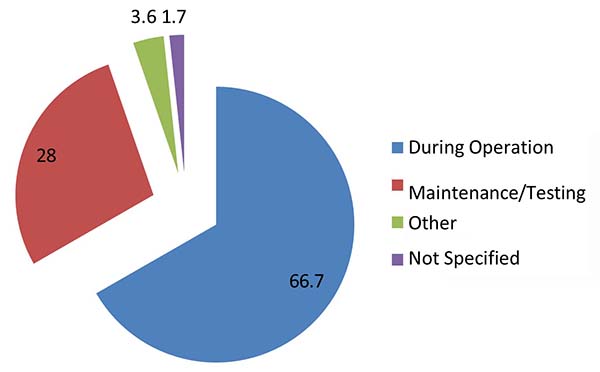
Figure 4: Time Failures Discovered (2)
The level of maintenance program and frequency of maintenance practices also significantly impacted the failure rate and the median hours of downtime per failure (Table 2).
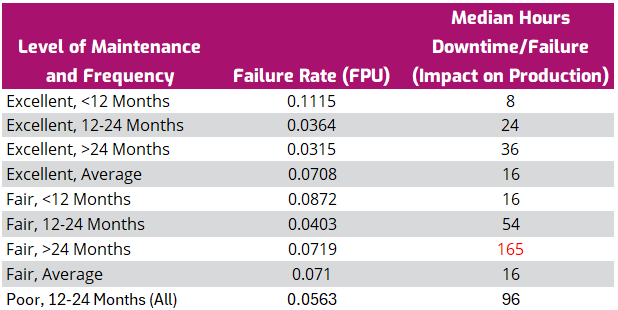
Table 2: Maintenance Vs. Failure Rate (2)
The maintenance practices that encompassed ‘excellent’ maintenance included:
- Visual inspections;
- Insulation resistance;
- Cleaning;
- Lubrication and/or filters;
- Vibration analysis;
- Bearing check/inspection;
- Ampere and temperature tracking;
- Air gap checks;
- Alignment; and,
- Check/change brushes, as applicable.
One explanation for the higher failure rate and the lower associated production average disruption was that potential faults were detected as part of the maintenance practice.
Applying the Findings to Today’s Motor Systems
Past electric motor studies have been incorrectly quoted for many years. A review of the associated studies identified that the actual opportunities are far greater than have been identified. The purpose of this paper was to demonstrate some of the information in relation to large, medium-voltage machines.
Primary opportunities include the use of continuous monitoring systems, such as temperature and vibration, and the application of technologies and maintenance practices that will avoid or detect electrical and mechanical faults. The result is a reduction in failure rate by about 1/3 and a significant reduction in production downtime.
While the studies were performed and published from 1973 through 1995, the information on failure rates remained similar throughout this period, and papers published as late as 2010 continue to support the original findings. The primary differences between the studies are the target industries and the failure modes listed by each study.
References
1. Albrecht, et.al., “Assessment of the Reliability of Motors in Utility Applications,” IEEE Transactions on Energy Conversion, Vol. EC-2, No. 3, September 1987
Albrecht, et.al., “Assessment of the Reliability of Motors in Utility Applications – Updated,” IEEE Transactions on Energy Conversion, Vol. EC-1, No. 1, March 1986
2. “Report of Large Motor Reliability Survey of Industrial and Commercial Installations, Part I” IEEE Transactions on Industry Applications, Vol. IA-21, No. 4, July/August 1985
“Report of Large Motor Reliability Survey of Industrial and Commercial Installations, Part II” IEEE Transactions on Industry Applications, Vol. IA-21, No. 4, July/August 1985
“Report of Large Motor Reliability Survey of Industrial and Commercial Installations, Part III” IEEE Transactions on Industry Applications, Vol. IA-23, No. 1, January/February 1987
3. Thorsen and Dalva, “A Survey of Faults on Induction Motors in Offshore Oil Industry, Petrochemical Industry, Gas Terminals, and Oil Refineries,” IEEE Transactions on Industry Applications, Vol. 31, No. 5, September/October 1995
4. Bonnett, Austin H., “Root Cause Failure Analysis for AC Induction Motors in the Petroleum and Chemical Industry,” Proceedings, 57th Annual Petroleum and Chemical Industry Conference, 2010