
Compressed air systems are an essential part of most plant operations but can be a plant’s most inefficient source of energy. To operate a one-horse air motor, you generally need seven to eight horsepower of electrical power into the compressor in a well-maintained system. At higher than typical pressures, even more power is required.
The overall efficiency of a typical compressed air system can be as low as 10-15%. For instance, annual energy costs for a one-horsepower air motor versus a one-horsepower electric motor, five days per week, two-shift operation, $0.05/kWh, would be $1,164 for compressed air versus $194 for the electric motor.
A single undetected air leak can waste thousands of dollars in energy costs every year—often without any visible signs of failure.
Leaks and other maintenance-related issues can have a more serious impact on a facility’s energy performance. A typical plant that has not been well maintained will likely have a leak rate in excess of 20% of the total compressed air production capacity. Proactive leak detection and repair can reduce leaks to less than 10% of compressor output.
Leaks can contribute to other operating losses and be a source of wasted energy. They cause a drop in system pressure, making air tools and other equipment function less efficiently and adversely affecting production. By forcing the equipment to cycle more frequently, leaks shorten the life of almost all system equipment, including the compressor package itself. Increased running time also leads to additional maintenance requirements, increased unscheduled downtime, and unnecessarily increased compressor capacity.
Since air leaks are almost impossible to see, other means must be used to locate them. The best way to detect leaks is to use an air-born ultrasonic detector, which can recognize the high-frequency hissing sounds associated with air leaks. These portable units consist of directional microphones, amplifiers, and audio filters and usually have visual indicators or earphones to detect leaks.
Another simple but more time-consuming method is to apply soapy water with a paintbrush to the inspected areas. Additional methods include smoke sticks, candles, foam, manometers, and stethoscopes.
To confirm impact, technologies such as Electrical Signature Analysis can be used to measure consumption reductions and identify defects within the compressed air system.
Real-World Case Study: Reducing Compressed Air Costs
In 1999, the author headed up the University of Illinois’ Energy Resources Center (UIC-ERC) food processing survey, which included a corn miller in central Illinois. During the survey of the facility, several common issues were determined, including:
- Air pressure drop from 110 psi to 45 psi in the packaging plant;
- Air leaks in the fungi and cooking plant;
- Open blow-off valve in one high-pressure (150 psi) filter, and,
- Long lengths of flexible air hoses and air hoses in poor condition.
A number of issues were identified within the compressed air system at the starch and gluten plant. These issues included an air pressure drop from 110 psi to 45 psi from the compressors to the end of the packaging line measured at the air regulators; the compressors did not have an opportunity to unload; compressed air is also used for the bag houses; and the need for a compressed air strategy.
Two 150-horsepower electric motors were running in two Sullair air compressors in the starch and gluten packaging plant. During the course of the study, these were monitored and found to operate at 90kW for a Siemens motor (AC702) and 130kW for a Lincoln motor (AC701).
The Siemens motor was found to be 73.8% loaded, and the Lincoln motor was 106.7% loaded. Both compressors remained online for the 48 hours of monitoring, and the system was found not to unload.
Unnecessary compressor additions often stem from pressure drops that could be fixed with better system design and maintenance.
The total input power of the compressed air system was found to be 220kW. Due to pressure drops and air demand, the corn milling plant planned to install an additional air compressor.
Through a basic walk-through of the compressed air system, several areas were identified: a complete understanding of the demand side of the compressed air system was not readily identifiable; the bag house air lines were not found and traced for air leaks; and there was a significant pressure drop across the packaging line from 100 psi to 45 psi. For the purposes of this paper, the compressed air opportunities will focus on the packaging line with general recommendations for the remaining compressed air system.
The challenges on the packaging line were identified by identifying the pressure drop. A general walkdown of the packaging line identified several audible air leaks that could be felt and heard. The pressure drop had the following estimated impact:
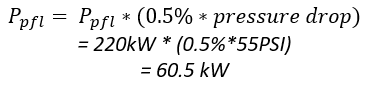
Equation 1: System Air Pressure Drop
Based on a 0.5% change in demand for every psi, the power required to maintain the pressure drop is 60.5 kW (81hp), 27.5% of the compressor load. The pressure drop was found to be a combination of pneumatic controls for the packaging line and air leaks.
A system for correcting the existing air leaks went a long way toward remedying the losses on the packaging line. The 60.5 kW potential with the following opportunity assuming a $0.10/kWh and $10/kW demand across 6000 hours per year operation and 95% efficient motors:
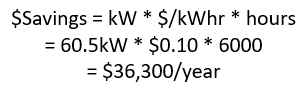
Equation 2: Energy Cost Savings (consumption)
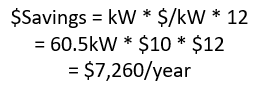
Equation 3: Energy Cost Savings (demand)
The total potential savings is $43,560 of the actual cost of use based upon measured motor input of 220kW, which is $158,000 per year, or a possible reduction of 28% of the operating costs and eliminating the need for a third compressor.
One of the first issues discovered was the lines’ failed compressed air system gaskets. One air leak at the compressor end of the production line was estimated to be a 3/8-inch leak. Other leaks through the system were quickly found audibly. Equations 4 – 5 relate to the losses due to the size of an air leak. Note that some online calculators and charts can be referenced.
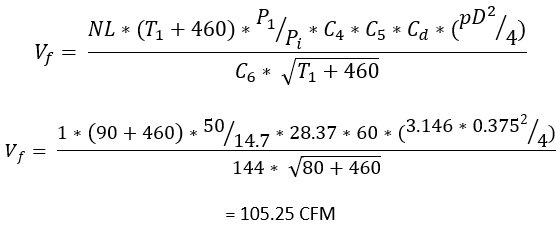
Equation 4: CFM Loss from a 3/8-inch Air Leak
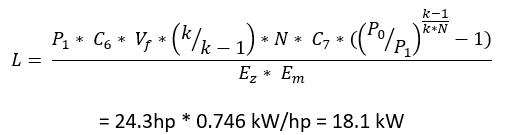
Equation 5: Power Loss Conversion from CFM
When applied to Equations 2 and 3, the air leak relates to a cost of $13,032/year.
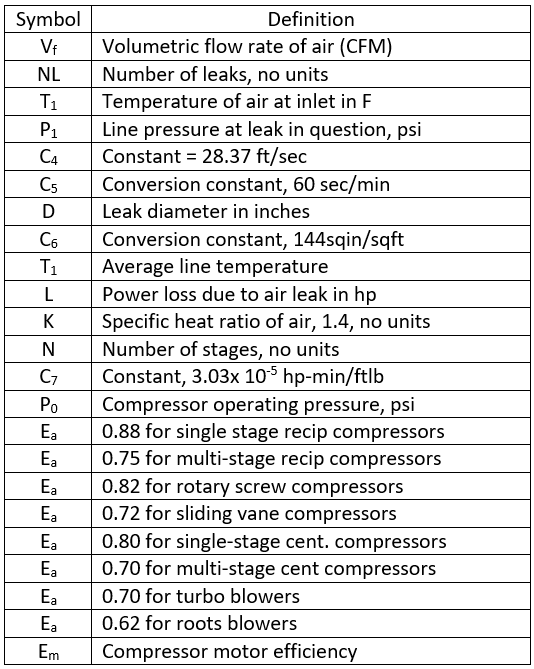
Table 1: Air Leak Formulae Definitions
Additional measures could be implemented before adding compressor capacity, including:
- Increase the capacity of the receiver. This would allow the compressors to load and unload (cycle), improving overall compressor system life;
- Balance the load on the two compressors. AC701 was 107% loaded, and AC702 was 74% loaded. By balancing the load on the two compressors, the life of the motor and compressor components on AC701 will increase;
- Install surge tanks near the bag houses served by the compressor system. This also reduced the load on the compressor system and improved the system line pressure. Without the surge tanks in place, air line pressure losses come into play based on the air line size and distance, reducing the effectiveness and pressure of air to the baghouses.
Major Air Leaks Identified in the Fungi and Cooking Plant
During the survey of the fungi and cooking plants, it was determined that there were two audible minor and one major air leak within the compressed air system without using an ultrasound leak detector. The first air leak was identified at the bottom end of a fungi tank, representing a ~0.25-inch opening.
Even small leaks can have a massive financial impact—one minor leak here cost over $21,000 annually.
Using the formulae from this article, this leak put out 140.33 cfm, resulting in a 30kW demand and representing $21,600 per year. The second air leak was found to be the same, and the noise required hearing protection to approach them.
Throughout the course of the study at the corn miller, it was difficult to enter an area immediately below and near the fungi tanks due to excessive noise. During a second phase study, the cause of the noise was identified and determined to be a large separator following a heat exchanger and before the drier on the high-pressure line (150 psi).
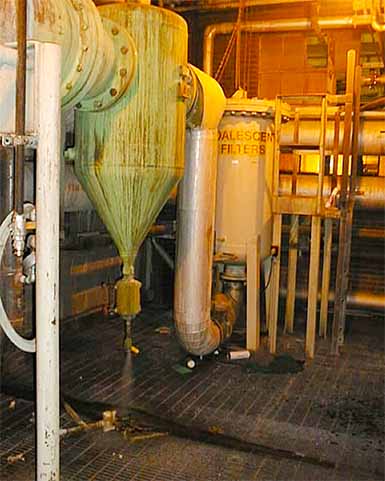
A blowoff valve left wide open
Based on the size of the piping, the amount of air, and the position of an open blow-off valve, this opening was conservatively determined to be 0.5 inches at 150 psi. Using the previous formulae, 561 cfm was being lost, accounting for 120 kW demand lost due to the open valve.
The total cost using the numbers in this article is estimated at $86,400. The primary recommendation for this opportunity was to install an automatic blow-off valve.
Key Strategies to Improve Compressed Air Efficiency
Throughout the site study, additional leaks and opportunities were identified. Following are a few extra recommendations for improving the compressed air system:
- Reduce long lengths of flexible compressed air hose. The alcohol storage tanks and several production areas had long lengths of flexible compressed air hoses. Pressure drops within the hose will be significant and can be avoided through running permanent air lines to equipment that requires compressed air and putting surge tanks near equipment that requires a great deal of compressed air to off-set additional line losses;
- Replace manual blow-off valves on compressed air filters and separators with automatic blow-off valves. This reduces maintenance requirements and ensures that blow-off valves are not maintained in the open position and,
- Establish a compressed air strategy that includes a compressed air maintenance and inspection strategy.
Developing a Proactive Compressed Air Maintenance Plan
A basic compressed air strategy consists of the following points:
- Storage requirements
- Make sure that primary storage is adequate
- Consider strategic secondary storage for some applications (surge tanks)
- Appropriate uses
- Evaluate each major class of compressed air end-use
- Check end uses against inappropriate uses
- Controls
- Periodically work with your equipment service provider to adjust individual compressor controls
- For systems with multiple compressors, use controls to orchestrate the compressors (sequence)
- Consider flow controllers
- Leaks
- Get the equipment necessary to find leaks
- Start looking in the right places
- Learn how to repair leaks
- Establish a leak prevention program
- Maintenance
- Follow the maintenance guidelines for the compressor and include the compressor system in your RCM development
- Develop a scheduled or condition-based maintenance program surrounding the compressed air system
When reviewing potential compressed air opportunities:
- Develop and then review a block diagram of the system
- Develop and review system pressure profiles. Remember, the nameplate horsepower is not always the true power consumption. Pressure drops across components are essential in developing loss and possible opportunities for improvement
- Develop and review the demand flow profile. If possible, flows should be measured. If not economically or physically feasible, use the manufacturer’s equipment rating or the best estimate using compressor loading when equipment is in service.
Final Thoughts: The Critical Role of Reliability in Air Systems
The relationship between reliability, maintenance, and production effectiveness cannot be overstated. In this article, we provided several examples of the impact of poor compressed air maintenance practices on the energy costs of a corn milling facility.
These were estimated numbers, and the actual before-and-after measurements through implementation were found to be very close. For instance, on the open 150 psi blow-off valve, the valve was closed while inspectors watched kW meters located at the co-generation facility.
While the actual energy cost numbers for the facility are not represented in this article, real consumption and demand numbers will have a significant impact, particularly with compressed air systems. In fact, in many facilities, even silent air leaks can justify a majority of an air leak program, including instruments and personnel.
Reference
Penrose, Howard W, A Novel Approach to Industrial Assessments for Improved Energy, Waste Stream, Process and Reliability, Success by Design Publishing, 1999, Connecticut, USA