
Understanding Key Performance Indicators (KPIs) in Maintenance
We often refer to metrics, a term meaning “to measure” (either a process or a result). Combinations of several metrics yield indicators, which serve to highlight some condition or a question that we need an answer to.
Key Performance Indicators (KPIs) combine several metrics and indicators to yield an assessment of critical or key processes. KPIs for maintenance effectiveness have been discussed, defined, and refined for as long as proactive maintenance has been carried out.
KPIs are only as useful as the actions they drive—tracking without improvement is just reporting.
KPIs combine key metrics and indicators to measure maintenance performance in many areas. We must define our corporate goals regarding maintenance management and the KPIs we will need to monitor to achieve them. This process is unique to each corporation and needs to be developed Independently.
One of the more interesting points here is that KPIs can be created hierarchically and interlinked, allowing management to pinpoint the root causes of system failures.
To determine maintenance strengths and weaknesses, KPIs should be broken down into areas for which you need to know the performance levels. In maintenance, these are areas such as preventive maintenance, materials management process, planning and scheduling, and so on.
Leading vs. Lagging Indicators: Predicting and Responding to Issues
Depending on KPI values, we classify them as either leading or lagging indicators. Leading indicators measure performance before a problem arises.
Leading indicators warn before failure, while lagging indicators confirm the damage—know the difference.
To illustrate this, think of key performance indicators as yourself driving a car down a road. As you drive, you deviate from the driving lane and veer onto the shoulder of the road, the tires running over the “out of lane” Indicators (typically a rough or “corrugated” section of pavement at the side of the road that serves to alert you to return to the driving lane before you veer completely off the pavement onto the shoulder of the road).
These “out of lane” indicators are the KPI that you are approaching a critical condition or problem. Your action is to correct your steering to bring your car back into the driving lane before you go off the road (proactive condition).
If you did not have the indicators on the pavement edge, you would not be alerted to the impending crisis, and you could veer so far out of the driving lane that you end up in the ditch. The condition of your car, sharply listing on the slope of the ditch, is a lagging indicator. Now you must call a wrecker to get you out of the ditch (reactive condition).
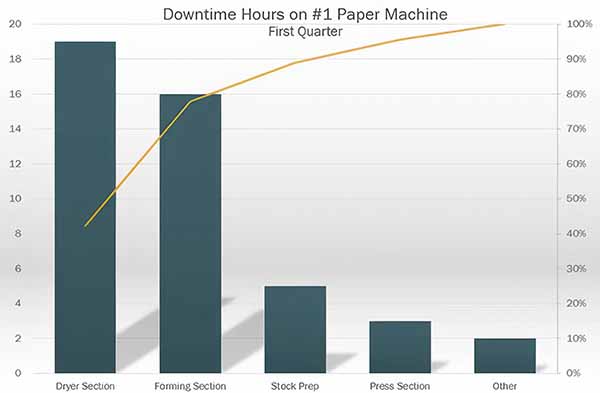
Lagging indicators (such as your budget) yield reliability issues, resulting in capacity issues. A manager must know if his department is squarely in the driving lane and that everything is under control as long as possible before it approaches and goes into the ditch. A list of some of the key performance indicators of the leading variety is illustrated in the Key Performance Indicators table below.
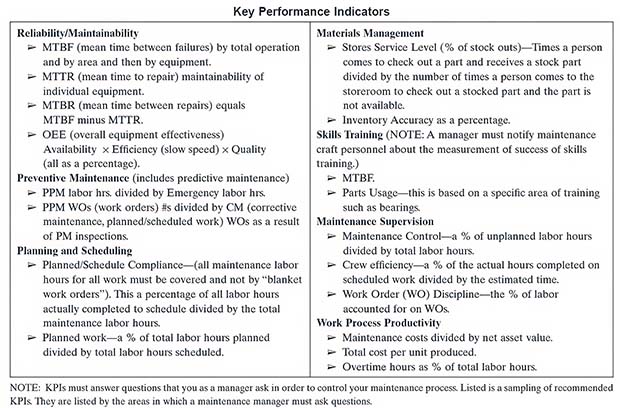
Note that some of these indicators could be both leading and lagging when combined with and applied to other KPIs.
Selecting the Right KPIs for Maintenance Success
The course to truly improve maintenance for the long term is not easy. However, after the initial difficult period, the system begins to manage itself, and the snowball of continuous improvement starts to be propelled under its own momentum.
The wrong KPIs can lead maintenance teams astray—selecting the right ones is critical to long-term success.
We will explore several levels and forms of maintenance productivity measurement. All functions and levels of management require control measures, but we must understand the differences in need, precision, source, and application.
Leading indicators are task-specific metrics that respond more quickly than lagging indicators (or results metrics). They are generally selected to anticipate progress toward long-term objectives that may not change quickly in response to effort. For example, training should improve skills, which should improve equipment reliability.
Leading indicators are metrics that help predict future trends and changes. They are forward-looking and proactive and can help identify potential problems before they occur.
Implementing a precision shaft-alignment training effort might take years to affect overall reliability measures such as MTBF and MTBR. In this case, a leading indicator of grouped MTBFs or MTBRs for applicable equipment might be selected to gauge the effectiveness of the training effort.
Technical metrics measure the effectiveness of equipment management programs and systems at the plant, unit, or equipment level. These metrics demonstrate the technical results of programs such as vibration monitoring, fluid (lubricating oil) analysis, and thermography. These are the first steps in gauging their contribution to corporate and plant performance.
In objective terms, technical metrics capture results that can be trended over time to track progress toward program objectives and demonstrate improvement. For example, a metric may be the percentage of predictive procedures performed within one week of schedule.
Selecting and Applying Metrics
The value of meaningful metrics cannot be overstated; the impact of inaccurate or inapplicable metrics cannot be understated. Metrics must connect to the organizational objectives. All the key processes should have one or more metrics to indicate goal compliance and progress.
Metrics should drive decisions, not just fill reports—if they aren’t actionable, they aren’t valuable.
In each case, the process owners and implementers must be involved in selecting metrics. The value of an effective CMMS or EAM is in its ability to retrieve automatic, real-time data that you can use.
The Equipment Management process is directed toward adding value. Metric selection and reporting must be consistent with that principle.
There are several rules to follow in applying metrics:
- Good metrics focus activities on maximum benefits and value-added Poor metrics lead away from optimum activities, often to unintended results
- Whenever possible, metrics should be positive rather than negative (e.g., measure first-run quality, not rework)
- Avoid conflicting metrics. Always examine complementary metrics together (i.e., there isn’t much benefit in directing efforts to increase yield if quality is significantly below objective)
- Noncompliance with a metric should be followed by efforts to identify the cause, full cost, and other effects of compliance; many organizations use Pareto analyses for this purpose
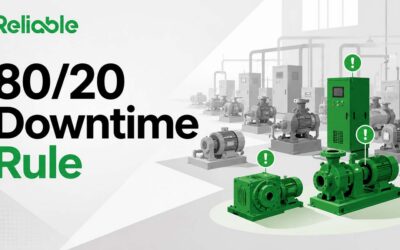
- When using Pareto analysis, some common KPI examples include customer complaint volume by category, sales revenue by product line, defect rates by production line, customer churn reasons, website abandonment points, project delays by cause, customer service call duration by issue type, and employee absenteeism by department; essentially, any metric where you can identify a significant portion of the impact coming from a smaller subset of contributing factors, following the “80/20 rule.”.
Metrics must be used and kept current; metrics not regularly used should be eliminated.
The more commonly used maintenance metrics or performance indicators can be classified into three categories:
- Measures of equipment performance, such as availability, reliability, and overall equipment effectiveness
- Measures of cost performance, such as labor and material costs of maintenance
- Measures of process performance, such as the ratio of planned and unplanned work, schedule compliance
Typically, these performance indicators are tracked for the following reasons:
- These indicators have been used by the organization in the past.
- Some of them are used for benchmarking with other organizations.
- The required data is easy to collect.
- Regulators or the corporate office mandates some of them.
These diagnostic measures determine whether the various aspects of maintenance operations remain under control or compare favorably with counterparts elsewhere. Thus, they are used largely to support operational control and benchmarking purposes. In general, these generic measures are inappropriate for providing a holistic assessment of maintenance performance.
Additionally, they do not provide information suitable for predicting the plant’s ability to create future value needed to support the organization’s business success. Performance measures linked to the maintenance function’s strategy must be tracked to achieve that end. These are known as strategic measures.
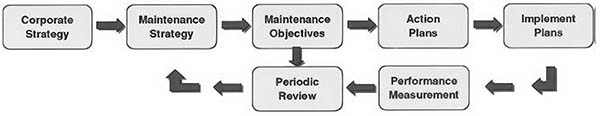
The figure below illustrates a process for managing maintenance performance from a strategic perspective.
The Balanced Scorecard Approach to Maintenance Measurement
A core feature of the process is the Balanced Scorecard (BSC), which provides a balanced presentation of strategic performance measures around four perspectives: financial, customer, internal processes, and learning and growth. Managers often find the strategy too abstract to guide them in making day-to-day decisions.
A well-designed Balanced Scorecard keeps maintenance aligned with corporate strategy.
By using the balanced scorecard, the strategy is translated into something more understandable and readily acted on: long-term (strategic) objectives that relate performance measures to their targets and action plans.
![]()
The balanced scorecard is a powerful communication tool that sharply focuses on factors that are important to maintenance’s contributions to the company’s business success. It enables a complete and balanced assessment of unit performance and guards against sub-optimization because all the key measures that collectively determine maintenance’s total performance are monitored.
The balanced scorecard, or performance scorecard, is a performance measurement system that helps a plant pursue its key success factors. It uses both internal and external benchmarking and employs a relevant cascading method of performance goal setting. Achievements are acknowledged and celebrated in “real-time” rather than at the traditional annual review.
Real performance improvement happens when KPIs drive action, not just awareness.
For a balanced scorecard process to be motivated, it must provide timely and accurate data. Simplicity is a key to the validity of measurements and the tractability of problems to their root cause. Data collection design must employ simple and easy-to-maintain databases to ensure data integrity.
When people are trained in this process and permitted to participate in relevant goal setting, Performance Management can motivate teams to achieve higher achievements, including exceeding growth and profit expectations.
Five Key Elements of the Balanced Scorecard Process
- Establish a “no status-quo” mindset—if you’re not winning, you’re losing
- Define company “key success factors”—examples: cost, speed and quality
- Identify stretch goals relevant to the company’s “key success factors.”
- Implement training/coaching programs—education is the pathway to excellence
- Celebrate each goal achievement and raise the bar—don’t wait until next year
For a mature performance management process, “benchmarking” has become the standard for establishing performance objectives. However, benchmarking is still one of the most ill-defined management concepts and is one of those words that means different things to different people.
Our preferred definition comes from Xerox, who describes benchmarking as:
“The continuous process of measuring our products, services, and business practices against the toughest competition, and those companies are recognized as industry leaders.”
The objective of benchmarking is to build on others’ ideas to improve future performance. The expectation is that by comparing your processes to best practices, major improvements can be realized.
Benchmarking is valuable, but internal performance tracking must come first.
You should not consider carrying out external benchmarking until you have thoroughly analyzed your internal operations and established an effective system of internal measurement.
So, what kind of results can you expect when a management team introduces the process of the balanced scorecard?
First, people will become motivated and focused on the continuous improvement of their company’s critical success factors. Second, personal and team achievements will become recognized and rewarded, creating an exciting, winning work environment. Teamwork will improve, and employee retention will rise.
Second, and most important, is the company-wide euphoria as “bottom-line” results improve and financial pressures no longer create a stressful and defensive work environment.
Third, Strategic Measures are measures applied by executive management to specify and monitor how well each function must perform in support of the competitiveness and ultimate viability of the enterprise. Internal attainment versus external industry leaders and world-class benchmarks is particularly applicable to Strategic Measurement. (see Table 2-6) Such measures for maintenance include:
![]()
![]()
The first three types, Preventive, Corrective, and some Condition/Test Procedures, should contain the following minimum information:
Procedure Number
The number is assigned to identify the procedure and index it when incorporated into the site-specific CMMS.
System Description
This section is text that describes the machine/equipment application.
Procedure Description
Text that describes the procedure purpose. The body of the procedure is often divided into subsections. Each subsection has a heading, which is duplicated in the Procedure Description. This ensures that the entire scope of work is well understood.
![]()
![]()
Work Orders Must Have the Following Items for Proactive Work
Special Tools
Identifies tools and test equipment the technician will need at the job site. Common tools are not usually identified.
Materials
All materials needed at the job site are listed in this section.
Reference Data
Identifies information, such as a test procedure, that the technician will need in order to perform the task. This section does not identify reference data that may have been used to develop the procedure. Only that reference data needed to perform the task is listed in this section.
Warnings
A warning is identified in the procedure anytime there is the potential for injury (including toxic release to the environment). This section lists every warning that is part of the procedure. If a warning is applicable many times in the procedure, it is shown each time it applies.
Cautions
Similar to the warning, a caution is identified in the procedure anytime there is the potential for damage to the equipment or damage to collateral equipment.
Notes
The procedure may also contain a note. A note provides relevant information to the person performing the procedure.
Preliminary
The first part of the procedure is identified as the preliminary section. This section includes all steps taken before going to the job site, or if at the job site, before starting work on the specified machine.
Although there is no maximum number of preliminary steps, this section is usually less than 10.
Procedure
The start of the procedure is clearly identified by the title “Procedure.”
The first step in the procedure is labeled “A” and is a phrase that identifies the work to be accomplished. The next step is labeled “A1” and is an action item. Each subsequent action step is numbered in ascending order, “A2, A3 . . .” If the procedure can be broken into discrete sections, there may be a “B,” “C,” etc.
Inspection/Measurement Data
If data is to be collected, there will usually be a Data section. The procedure will identify the data and direct where it is recorded in the Data section or other location. The Data section is always located at the end of the Procedure section.
Actual Time
A space to record the actual time that was required to perform the procedure. The Planner and Scheduler use this information to refine the estimated time for more accurate scheduling.
At the plant’s option, there may also be a place to record the name of the lead person performing the maintenance action. Maintenance personnel skill levels, management requirements, and utilization for training determine the level of detail contained in each Maintenance Requirement procedure.
Procedures can be an element of maintenance training by incorporating the maximum level of procedural detail with line entries for:
Related Tasks
Identifies other tasks that should be performed. Usually, tasks with a shorter periodicity. For example, an annual procedure will identify semiannual, quarterly, or monthly procedures
to ensure all work is done during a single equipment maintenance shutdown.
Periodicity
Describes how often the procedure is scheduled. Codes usually used are:
D = Daily, W = Weekly, M = Monthly, Q = Quarterly, S = Semi-Annually, and A = Annually.
Multiples of the above are sometimes used and are identified by a number followed by a letter. For example, 5A indicates that the procedure is scheduled every 5 years.
Craft & Labor (Hrs.) The craft(s) required to perform the procedure are shown and will be followed by two numbers.
First is the number of people
Second is the estimated time for each person. For example, 2 people/2 hrs. each. The time estimate is to perform the task. Because each site is different, no time was estimated to get to the job site.
![]()
![]()
![]()
Excerpts from Industrial Machinery Repair by Ricky Smith CMRP, CMRT and Keith Mobley.